Monitor
The Monitor tab, lets you track all the incoming events for all your functions.
Filtering Events
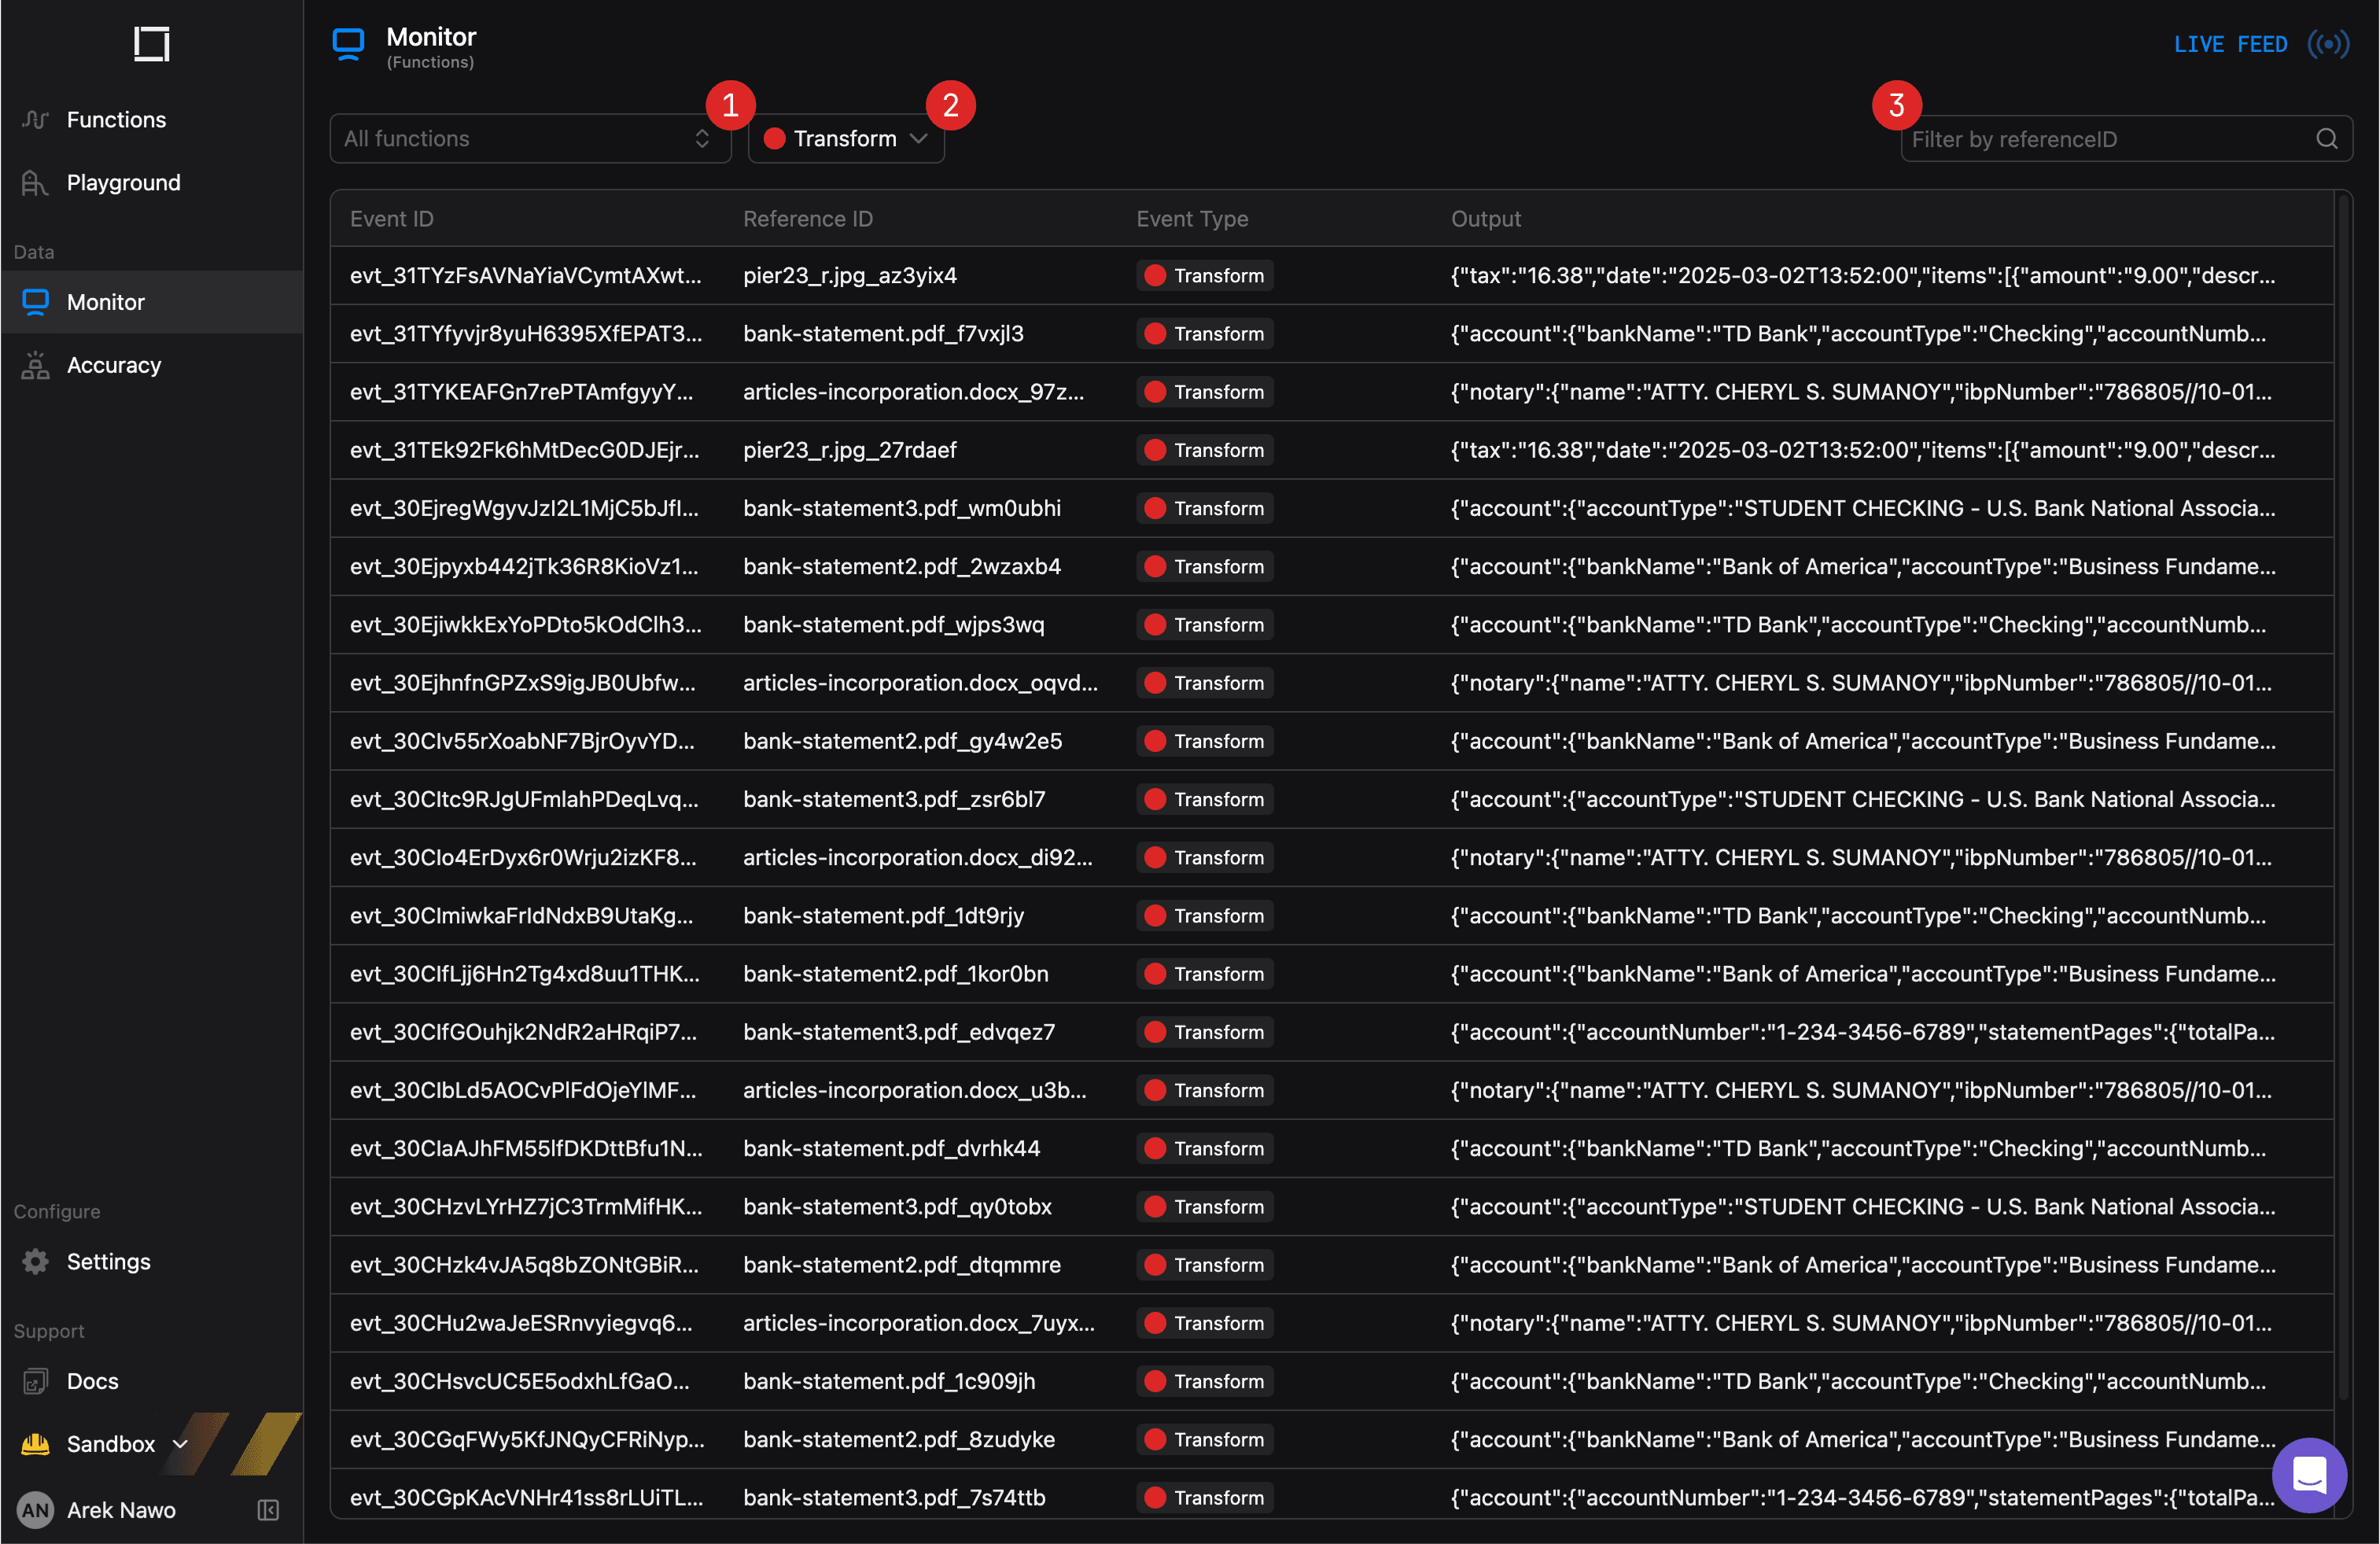
- Use the function selector(1) to filter events by a specific function;
- Filter events by their type using the dropdown on the right of the function selector(2);
- Search for the exact reference ID match by using the search bar on the left(3).
Inspecting Events
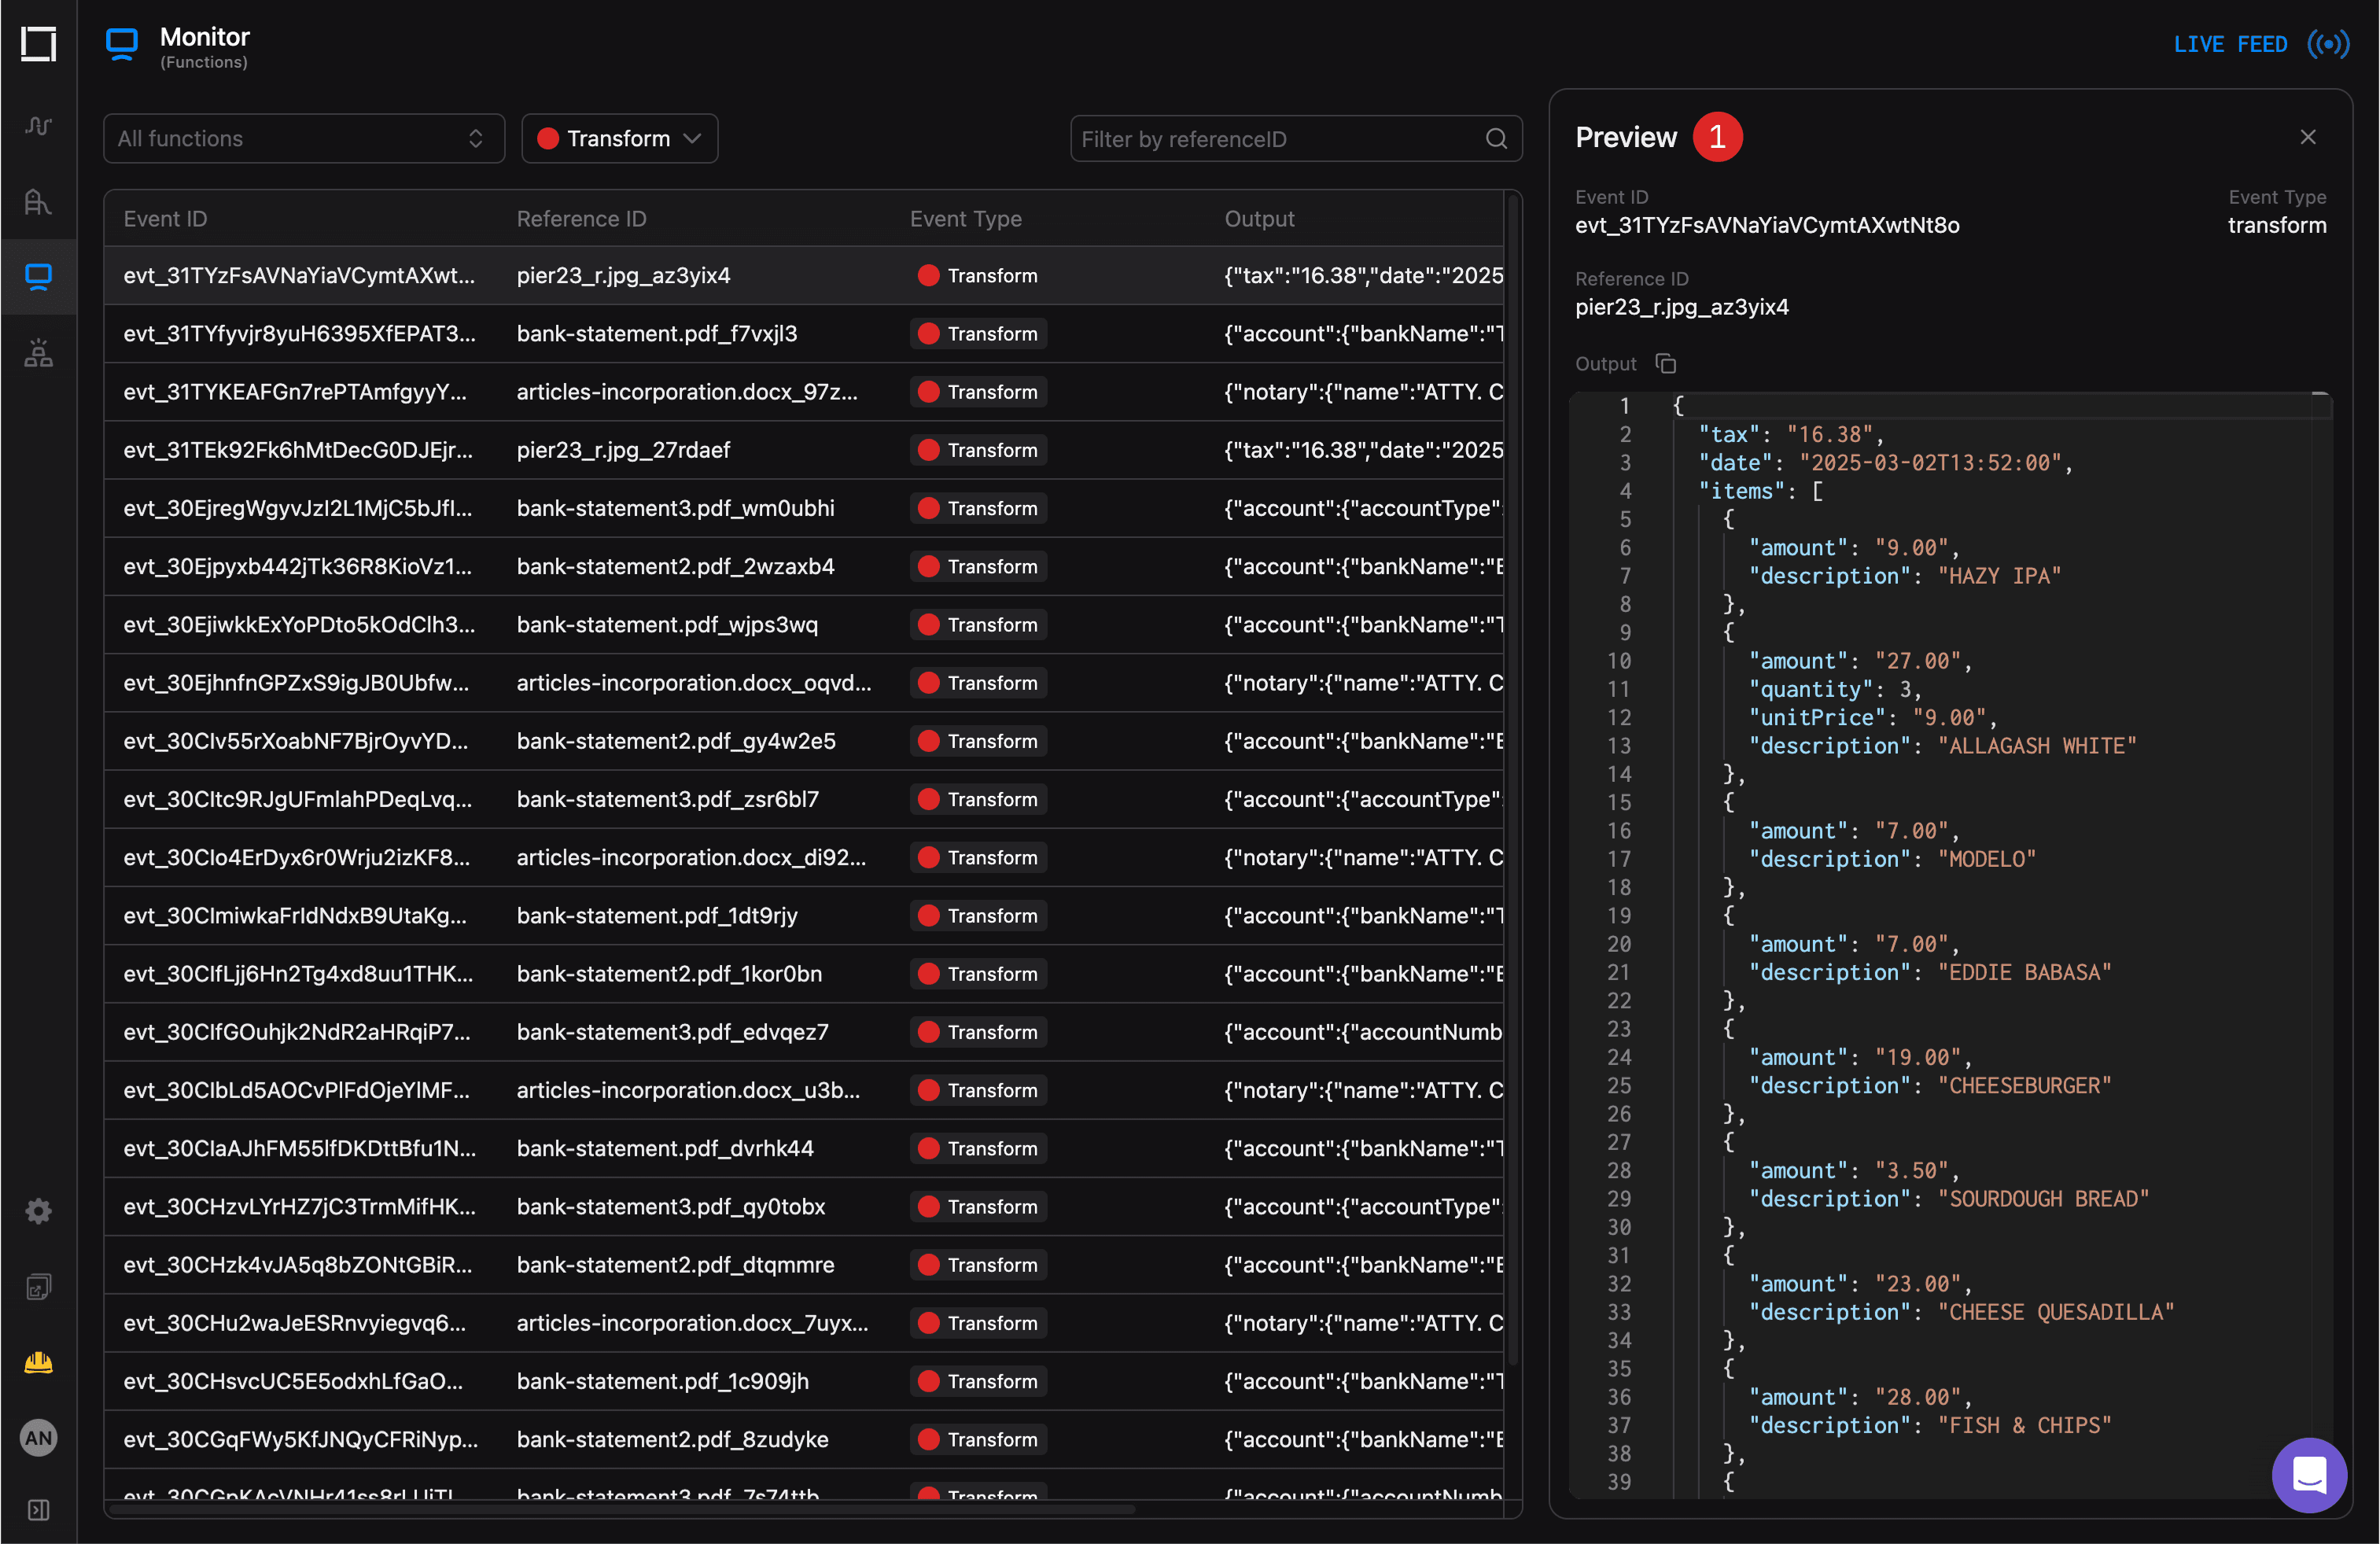
The live feed of incoming events matching the applied filters is displayed in the table, showing the event's data, including its Reference ID and Output - e.g. the transformedContent of the transform or join event, or the error message of the error event.
You can click on any event to view its details in a dedicated Preview panel(1) on the right side.