Overview
Find your way around the bem dashboard
Use the bem dashboard to build workflows, test them with sample files, and check their results.
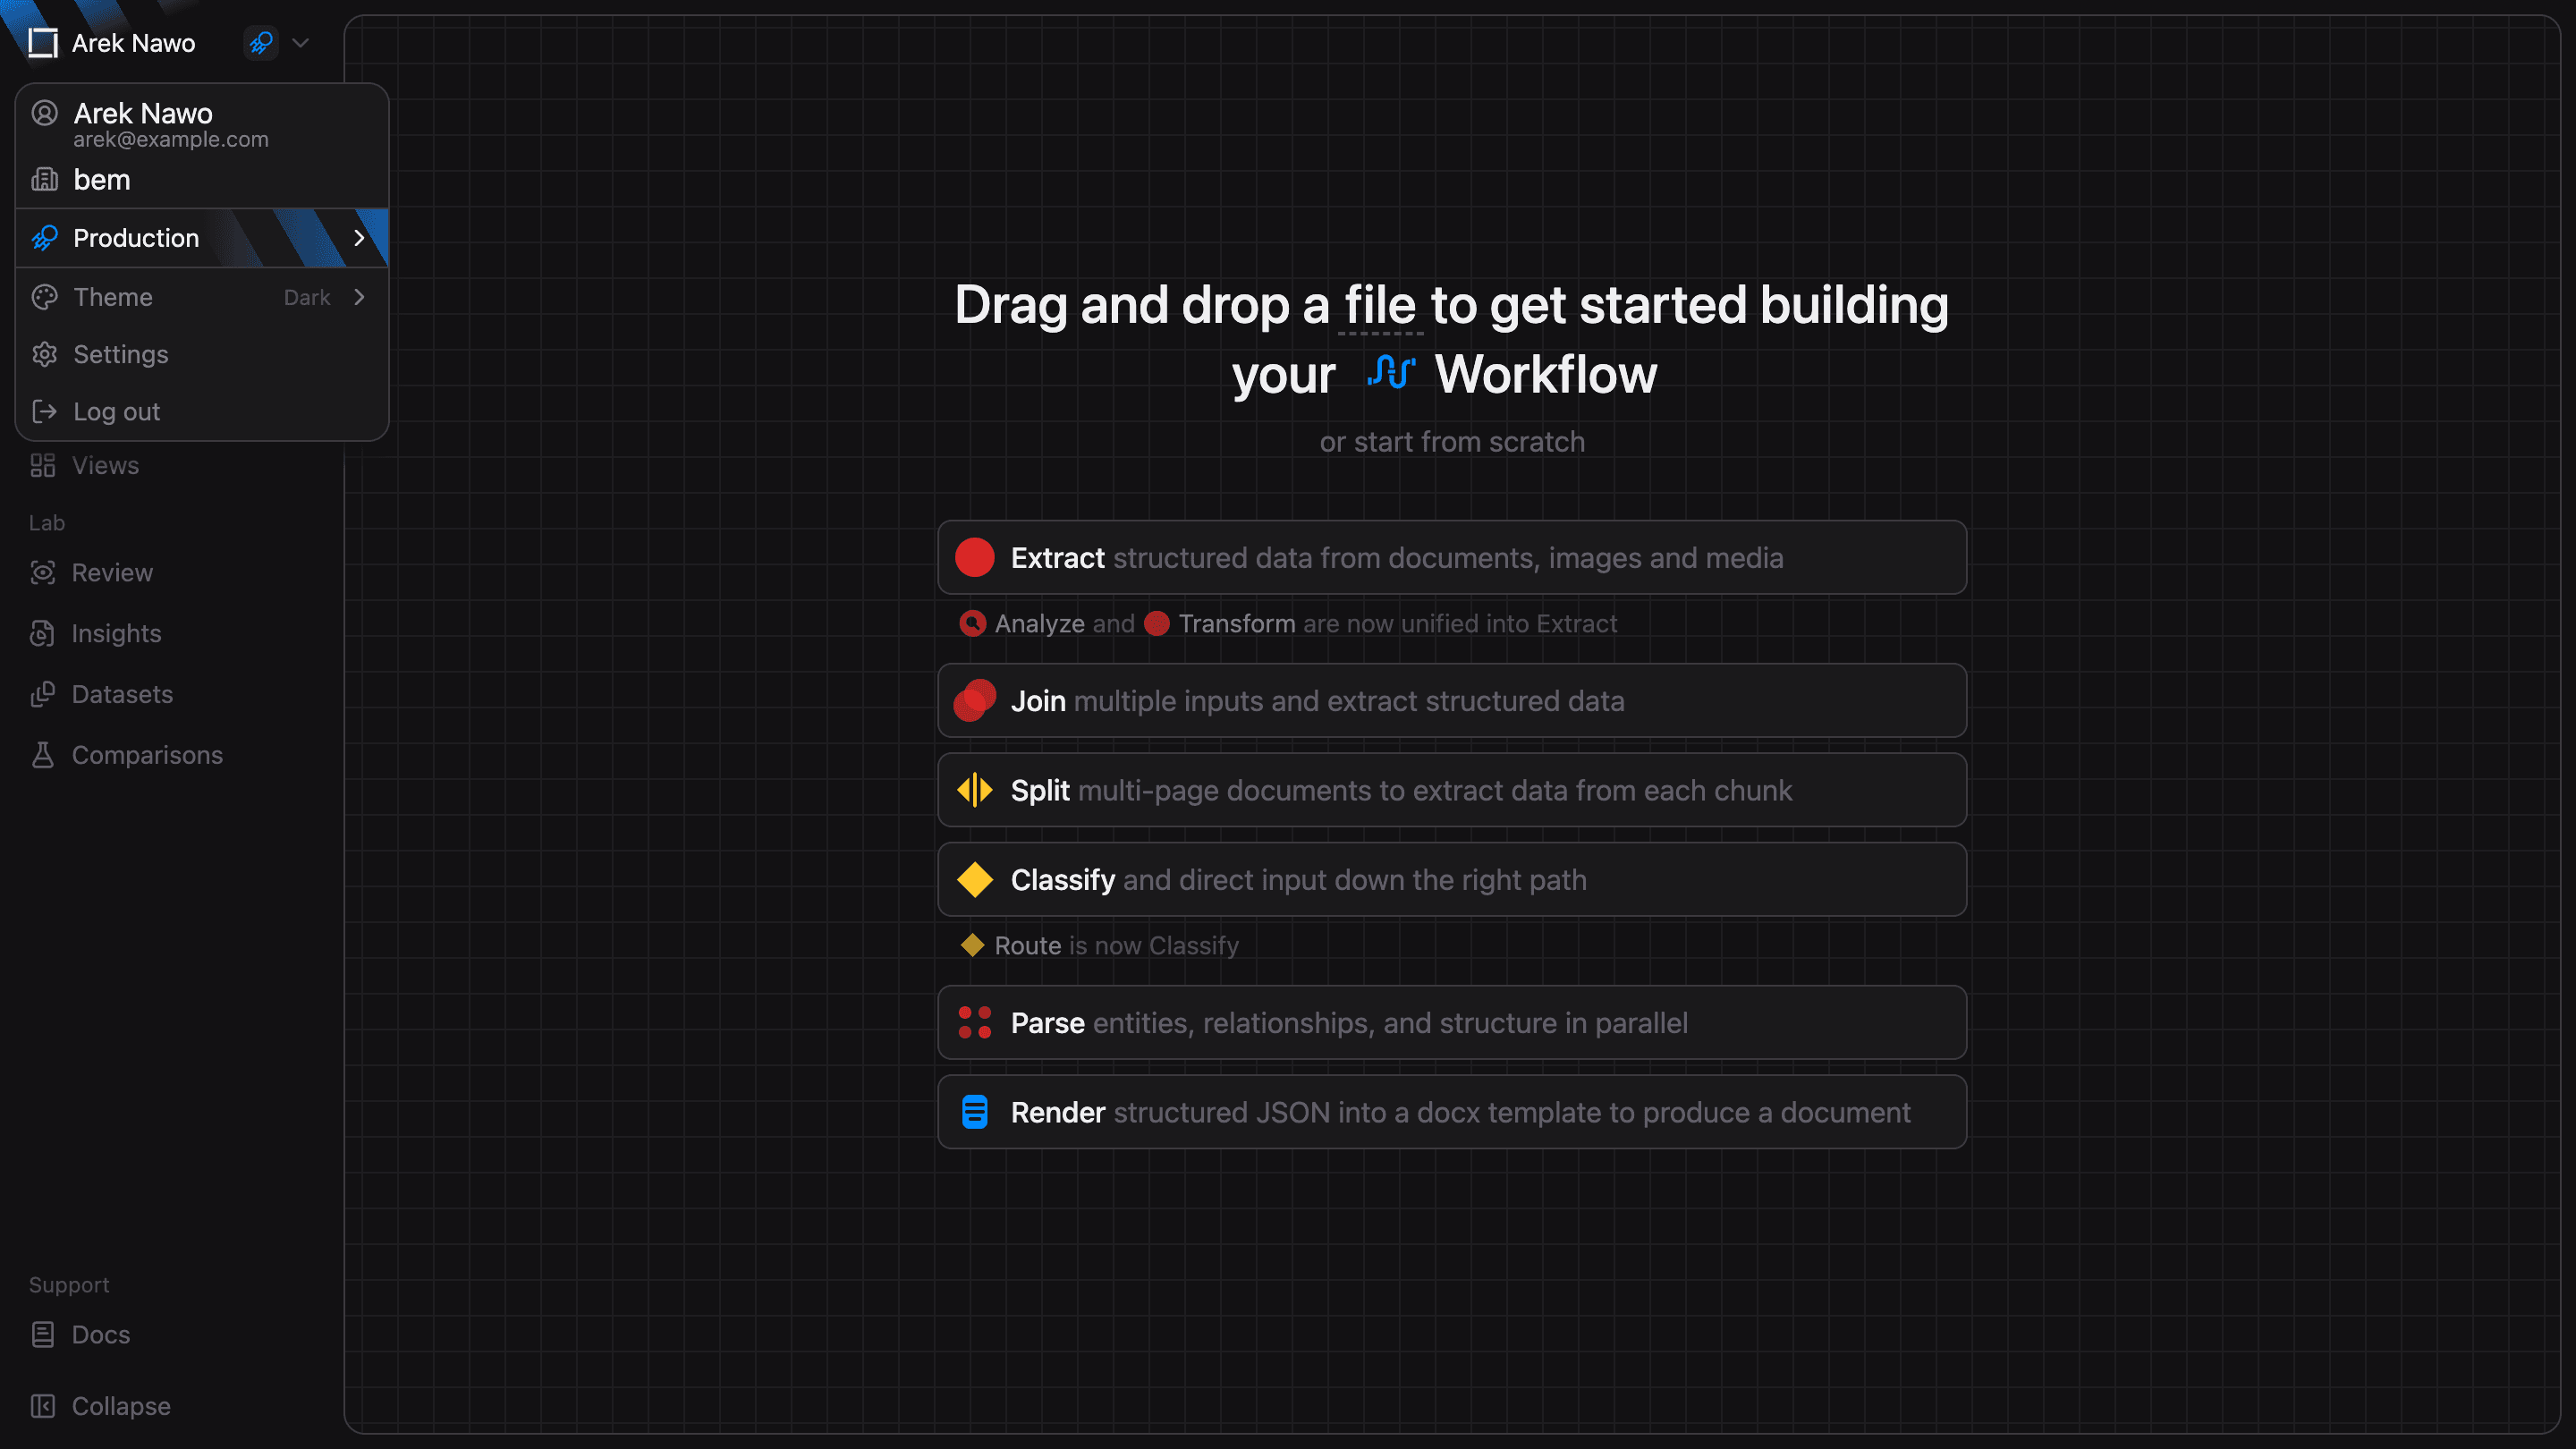
Before you start, check the active environment in the account menu at the top of the sidebar. Switch between Sandbox and Production there to work with the correct workflows and data.
Build a workflow
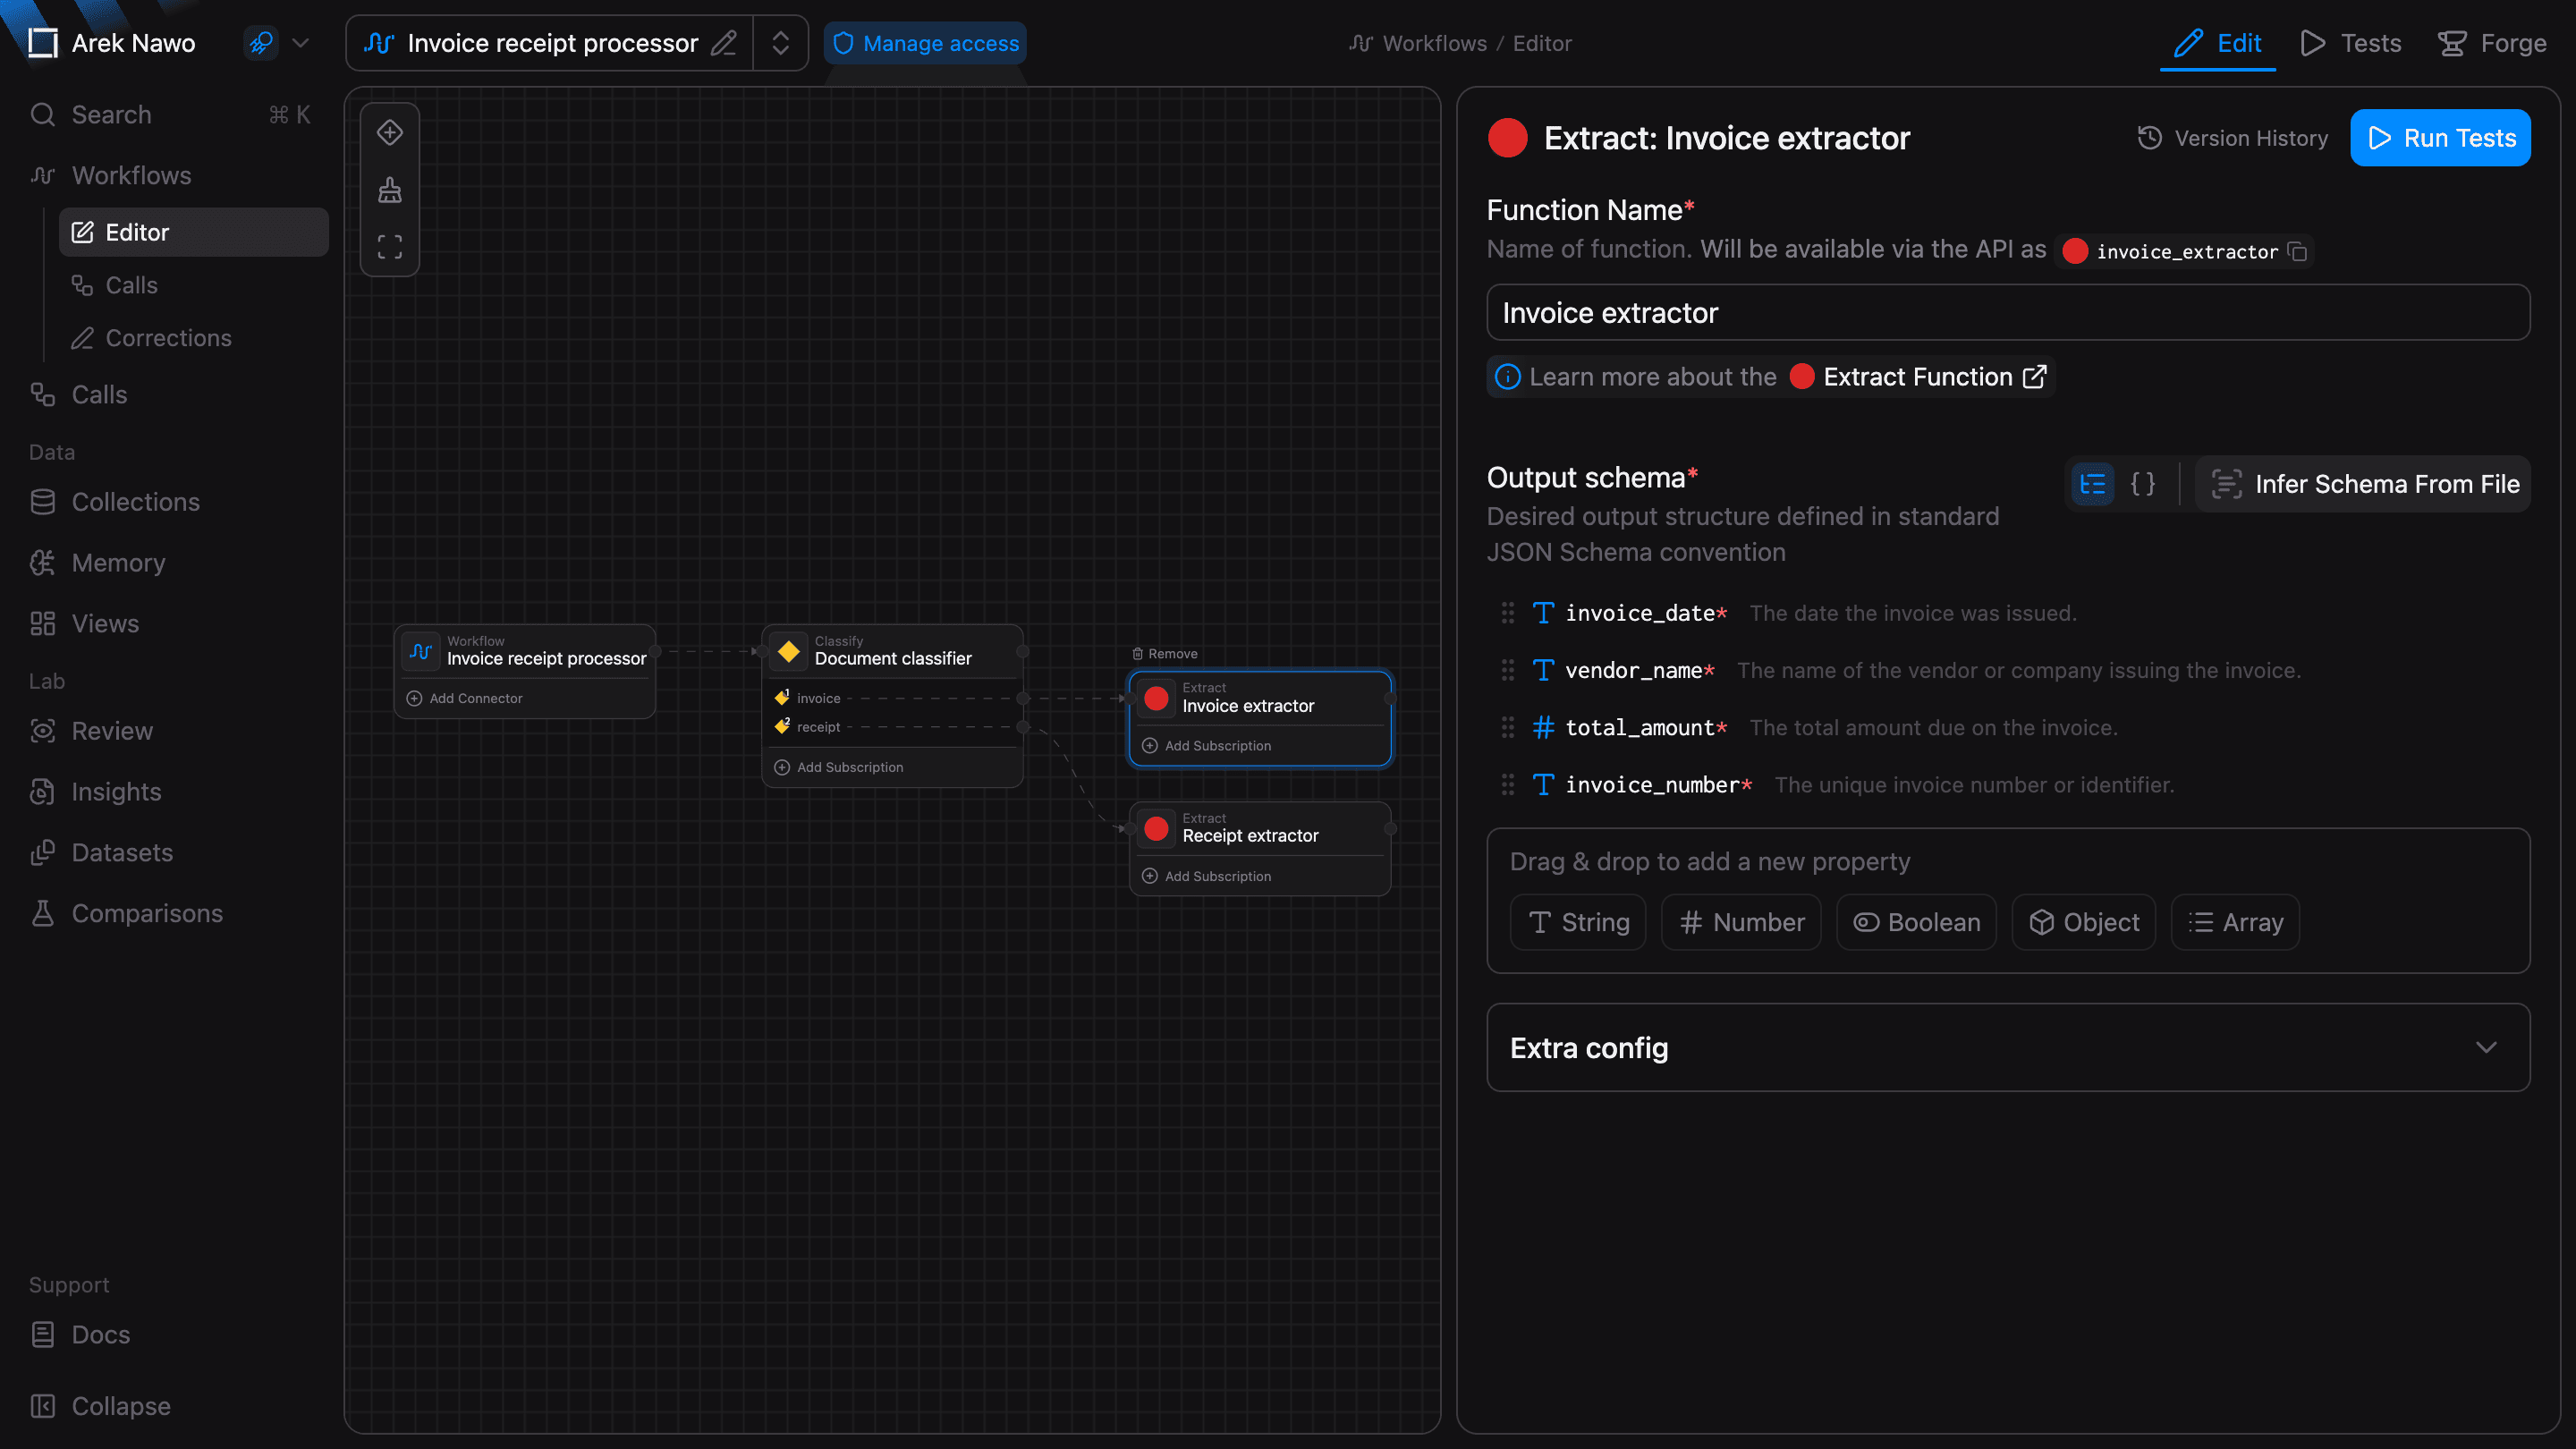
Start from Workflows to create a workflow or open an existing one. In the Workflow Editor, you can configure each step and test it with sample files. If you prefer to describe what you need, use Forge to build and change the workflow through a conversation.
To find a resource quickly, open Search or press ⌘ K on macOS or Ctrl K on Windows and Linux.
Check results
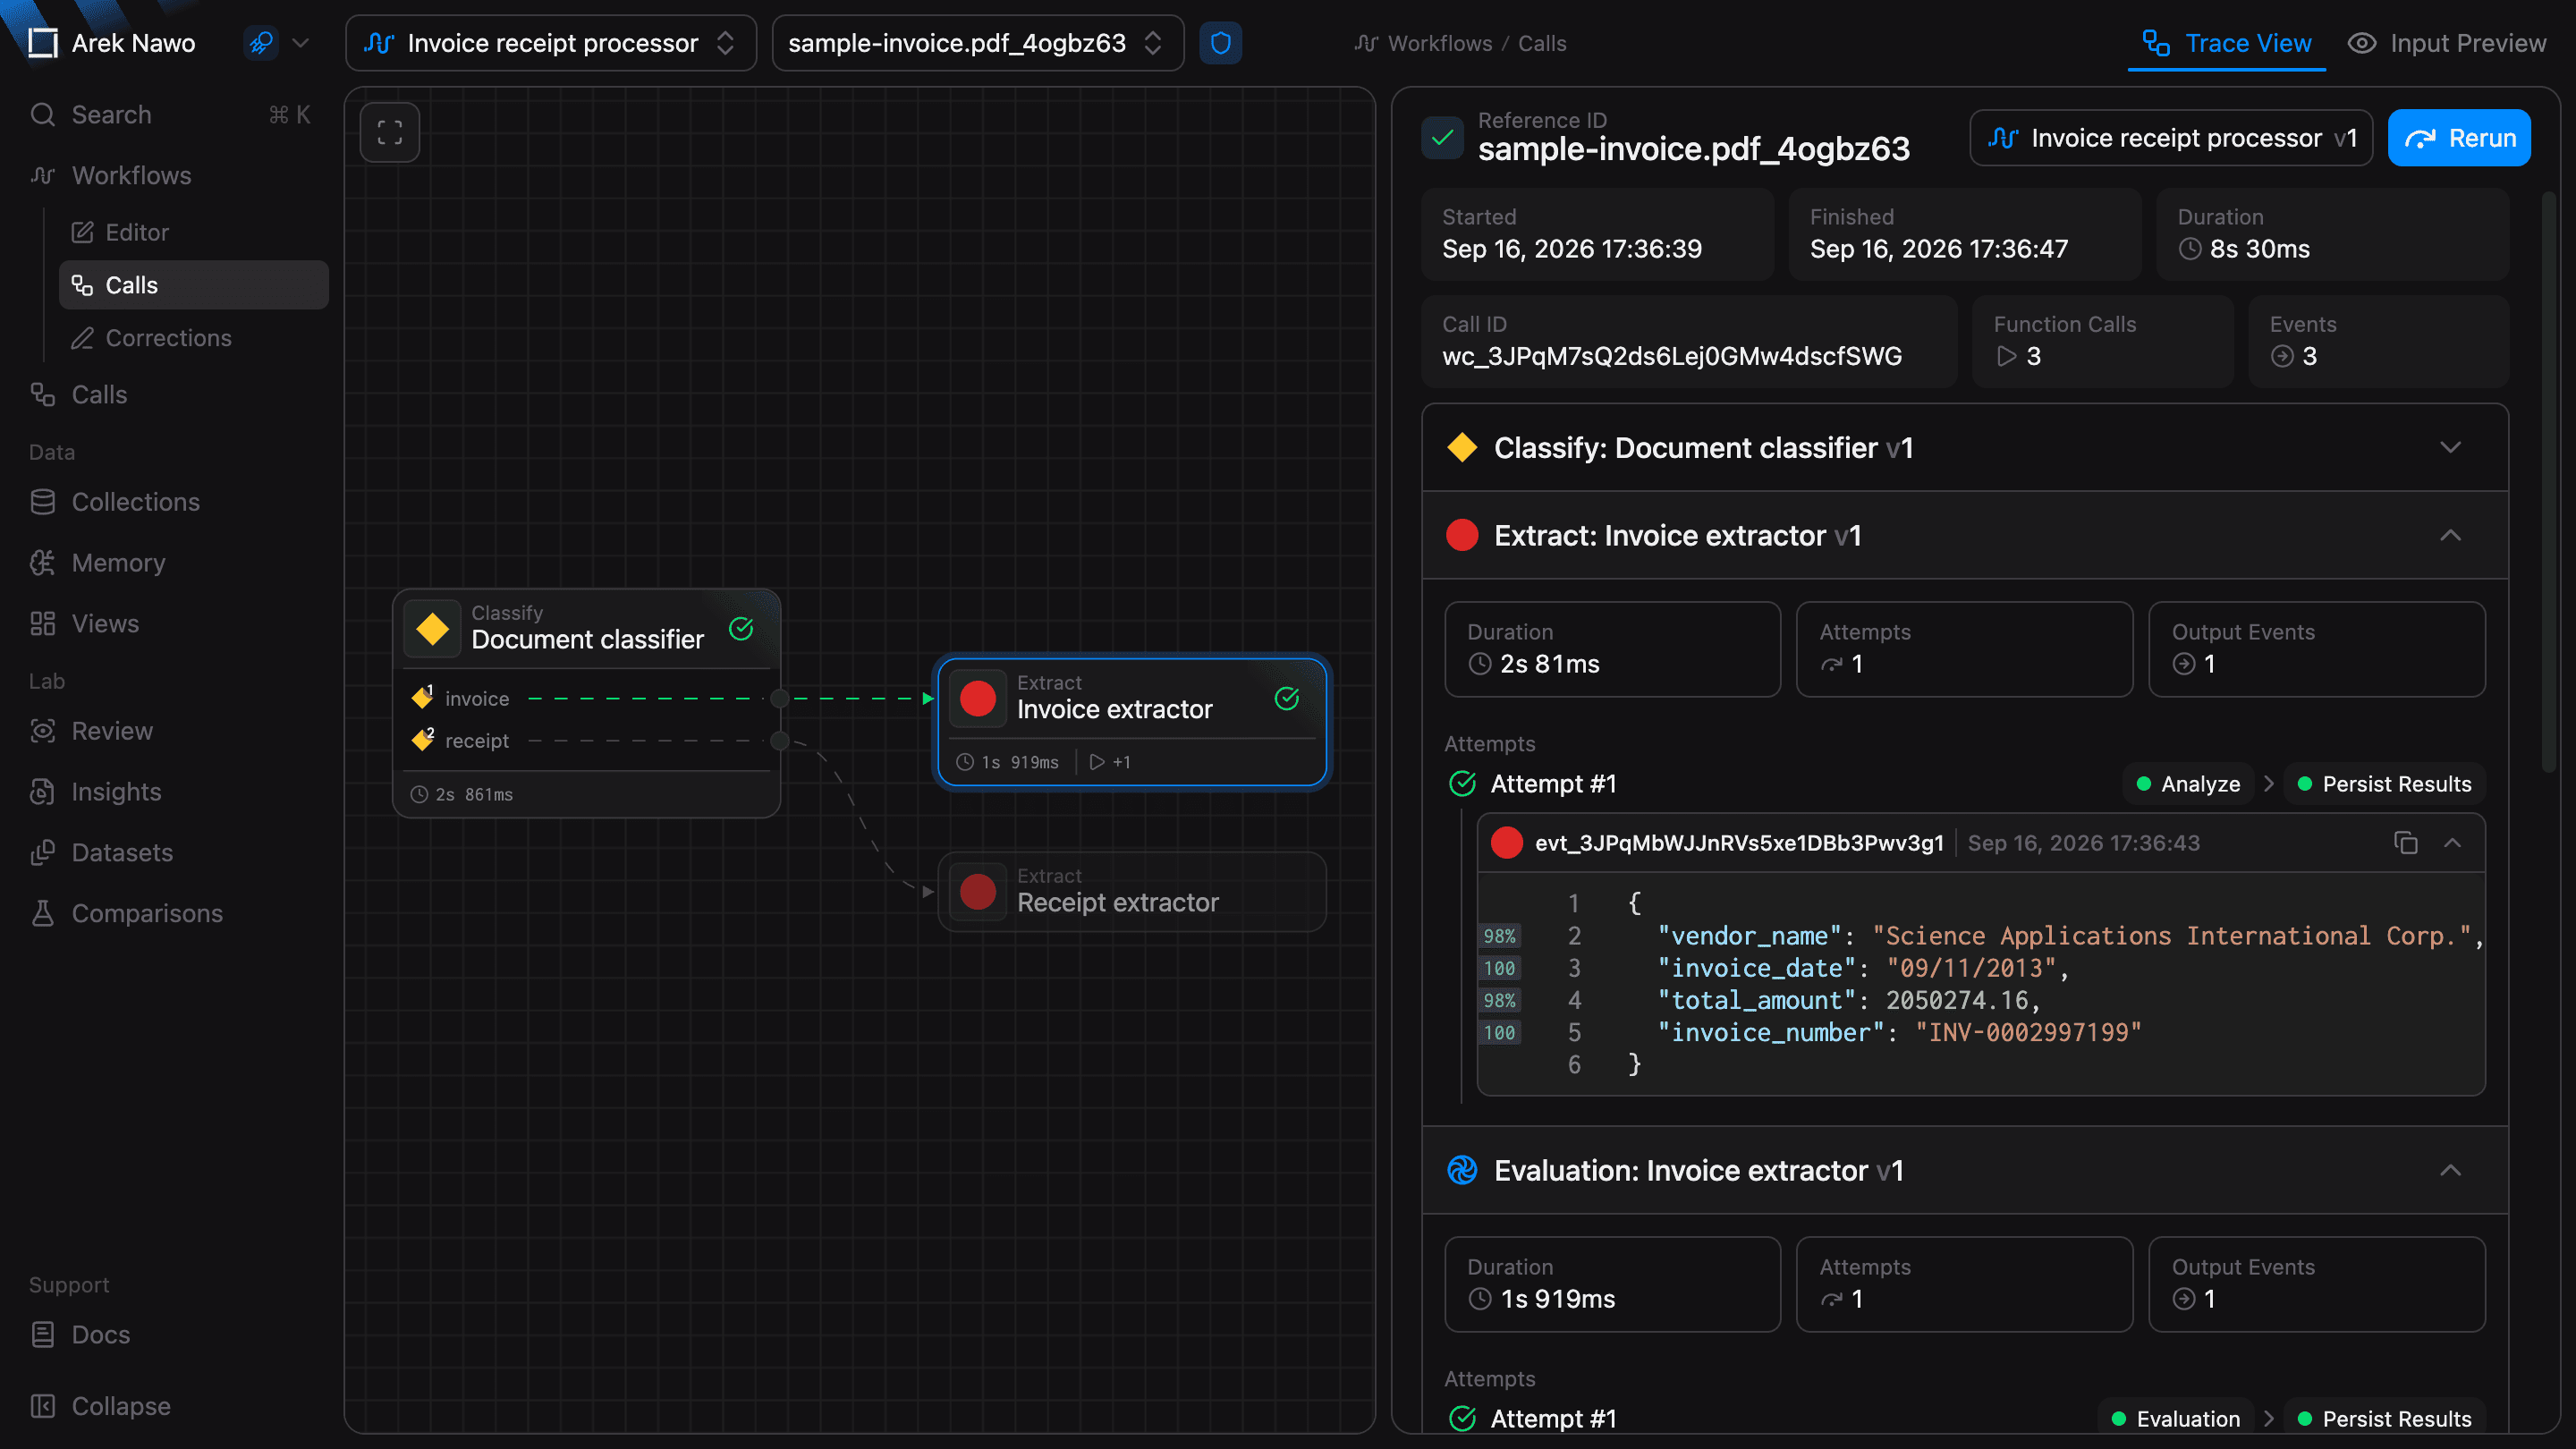
A call is one run of a workflow. Open Calls to find runs across the active environment. Within a workflow, Calls shows its inputs, outputs, and the steps that ran. Use this view to investigate an error or an unexpected result.
Use Corrections to confirm accurate outputs or fix incorrect values. The Lab section helps you review accuracy and performance, and compare function versions before you use a change.
Work with data
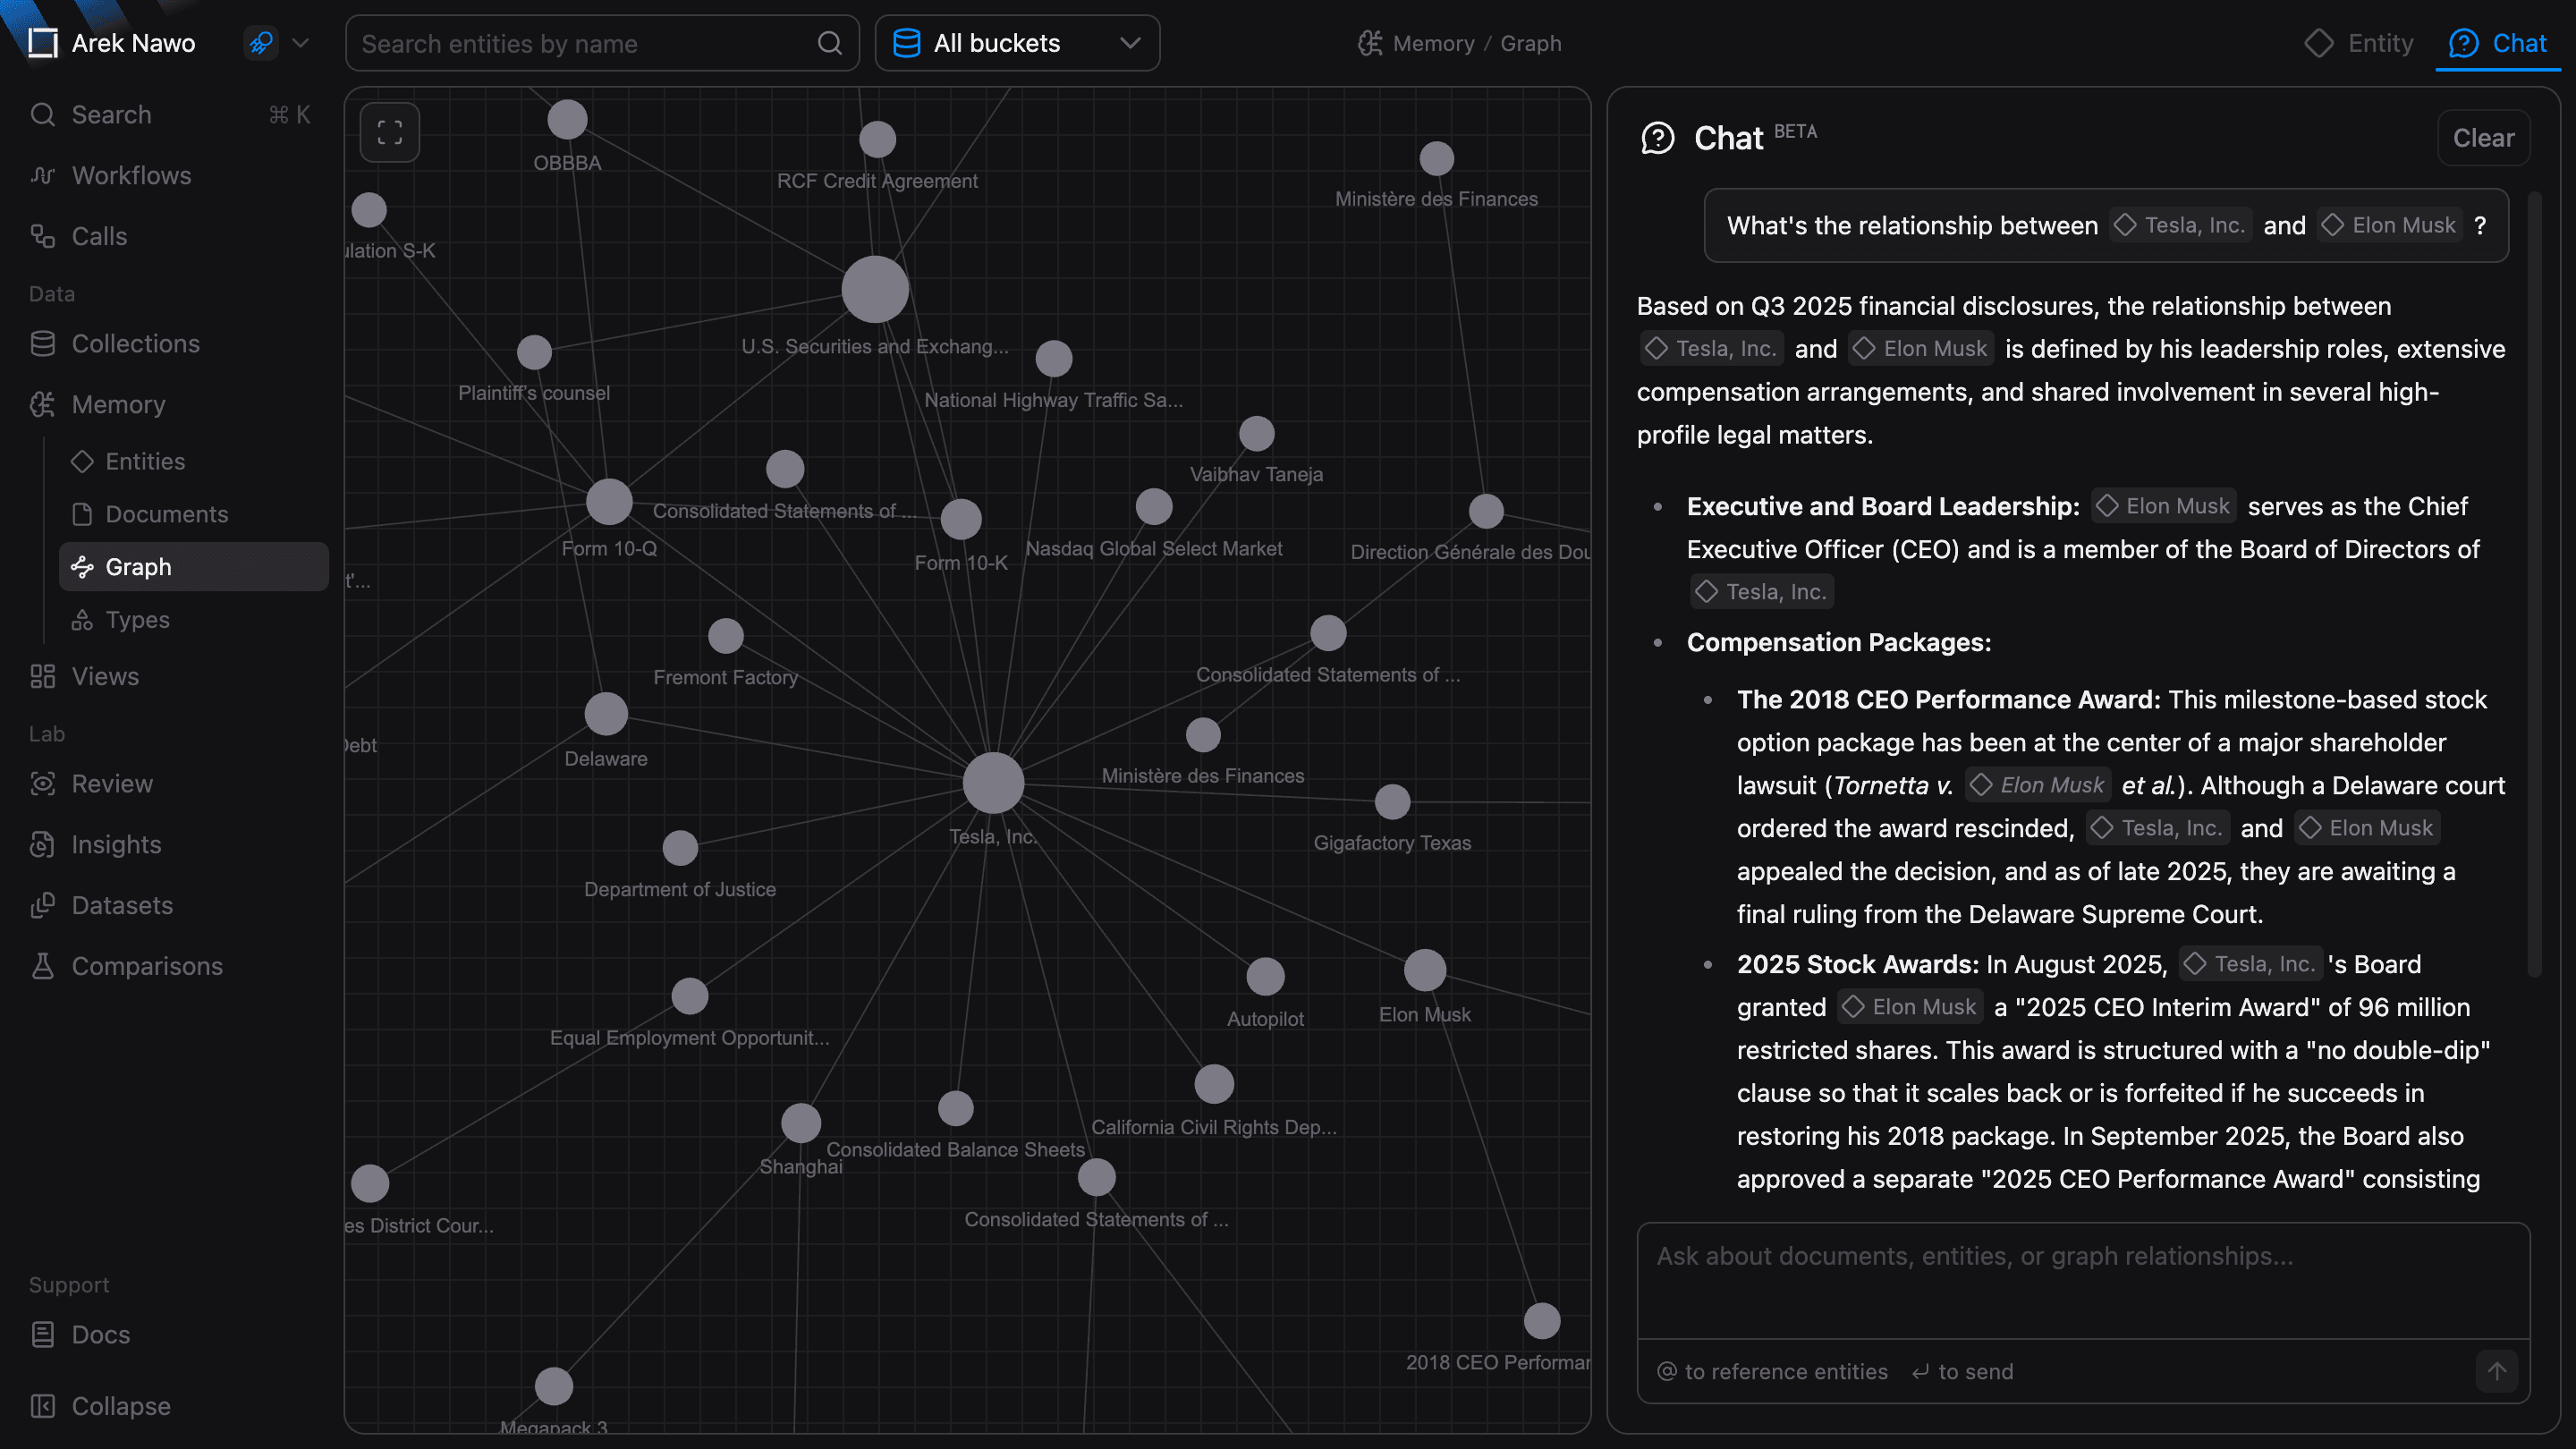
Under Data, Collections stores reference data for Enrich functions, while Memory shows the entities, documents, and relationships in your knowledge graph. Use Views to turn function outputs into tables and charts.
Settings and access
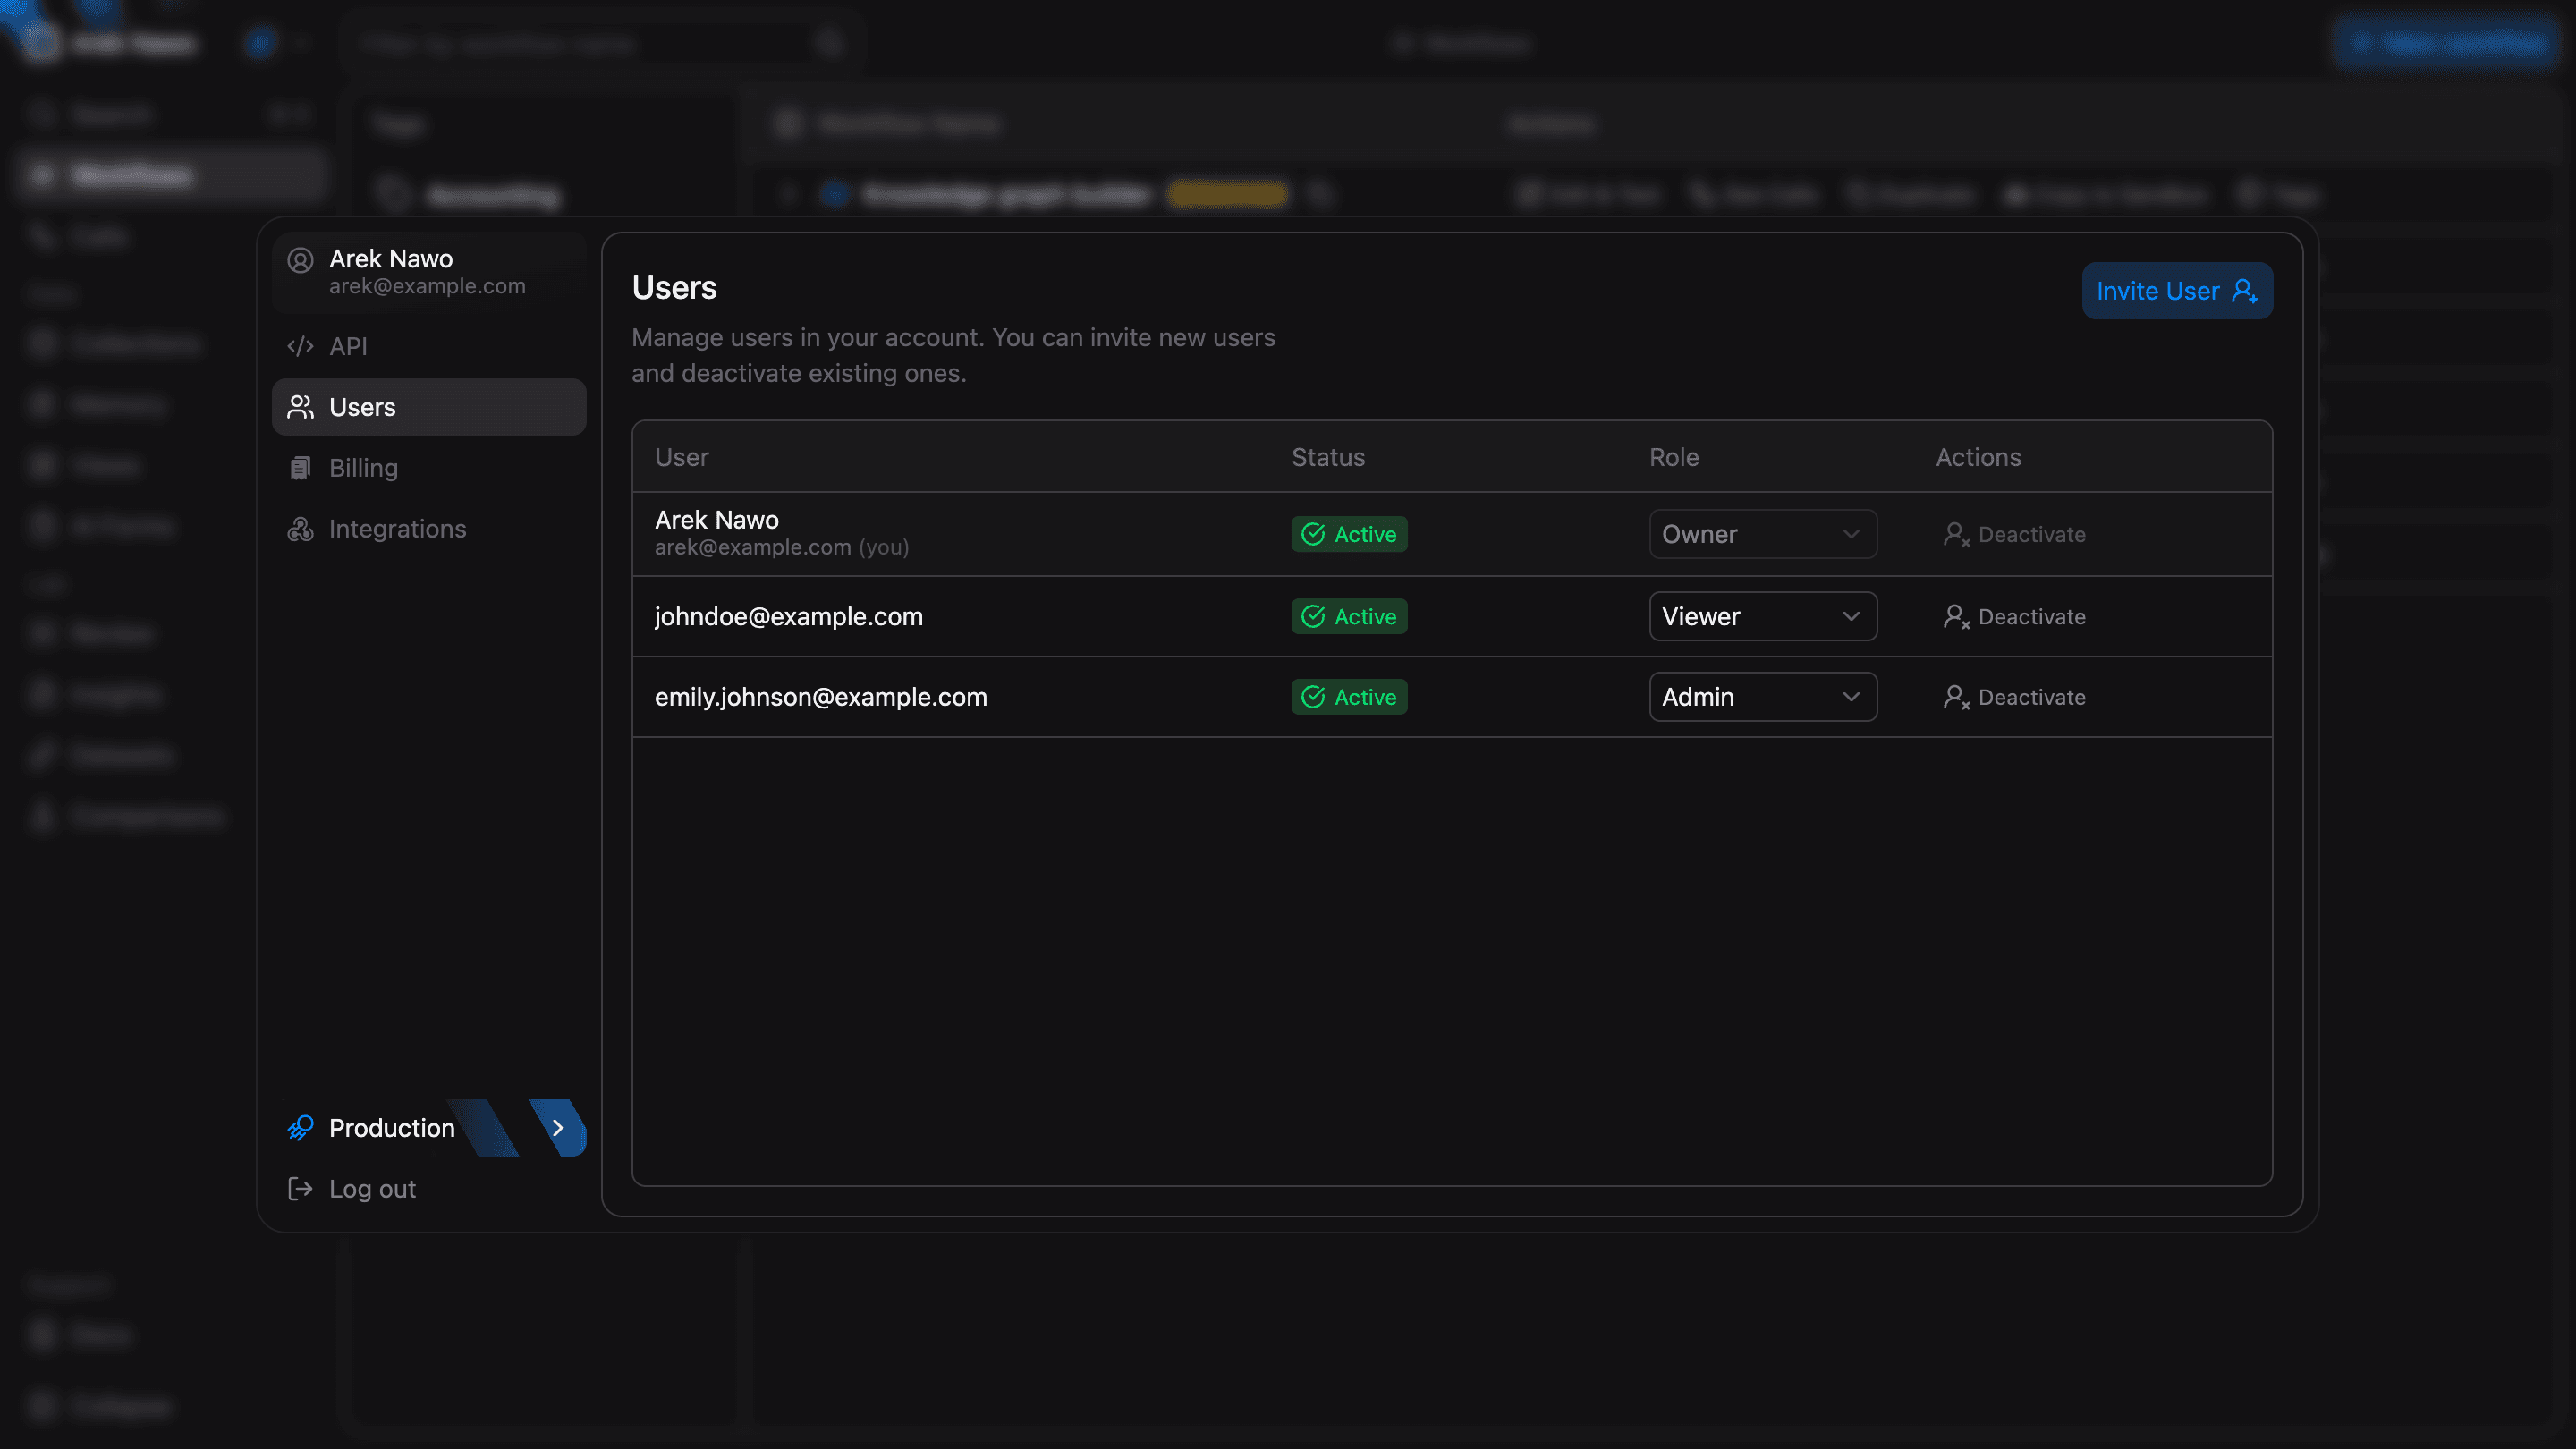
Open Settings from the account menu to manage API access, integrations, account members, and billing. Your role controls which pages and actions are available. If an action is missing, check Access Control for the permissions it requires.