Views
Build tables and charts from function outputs
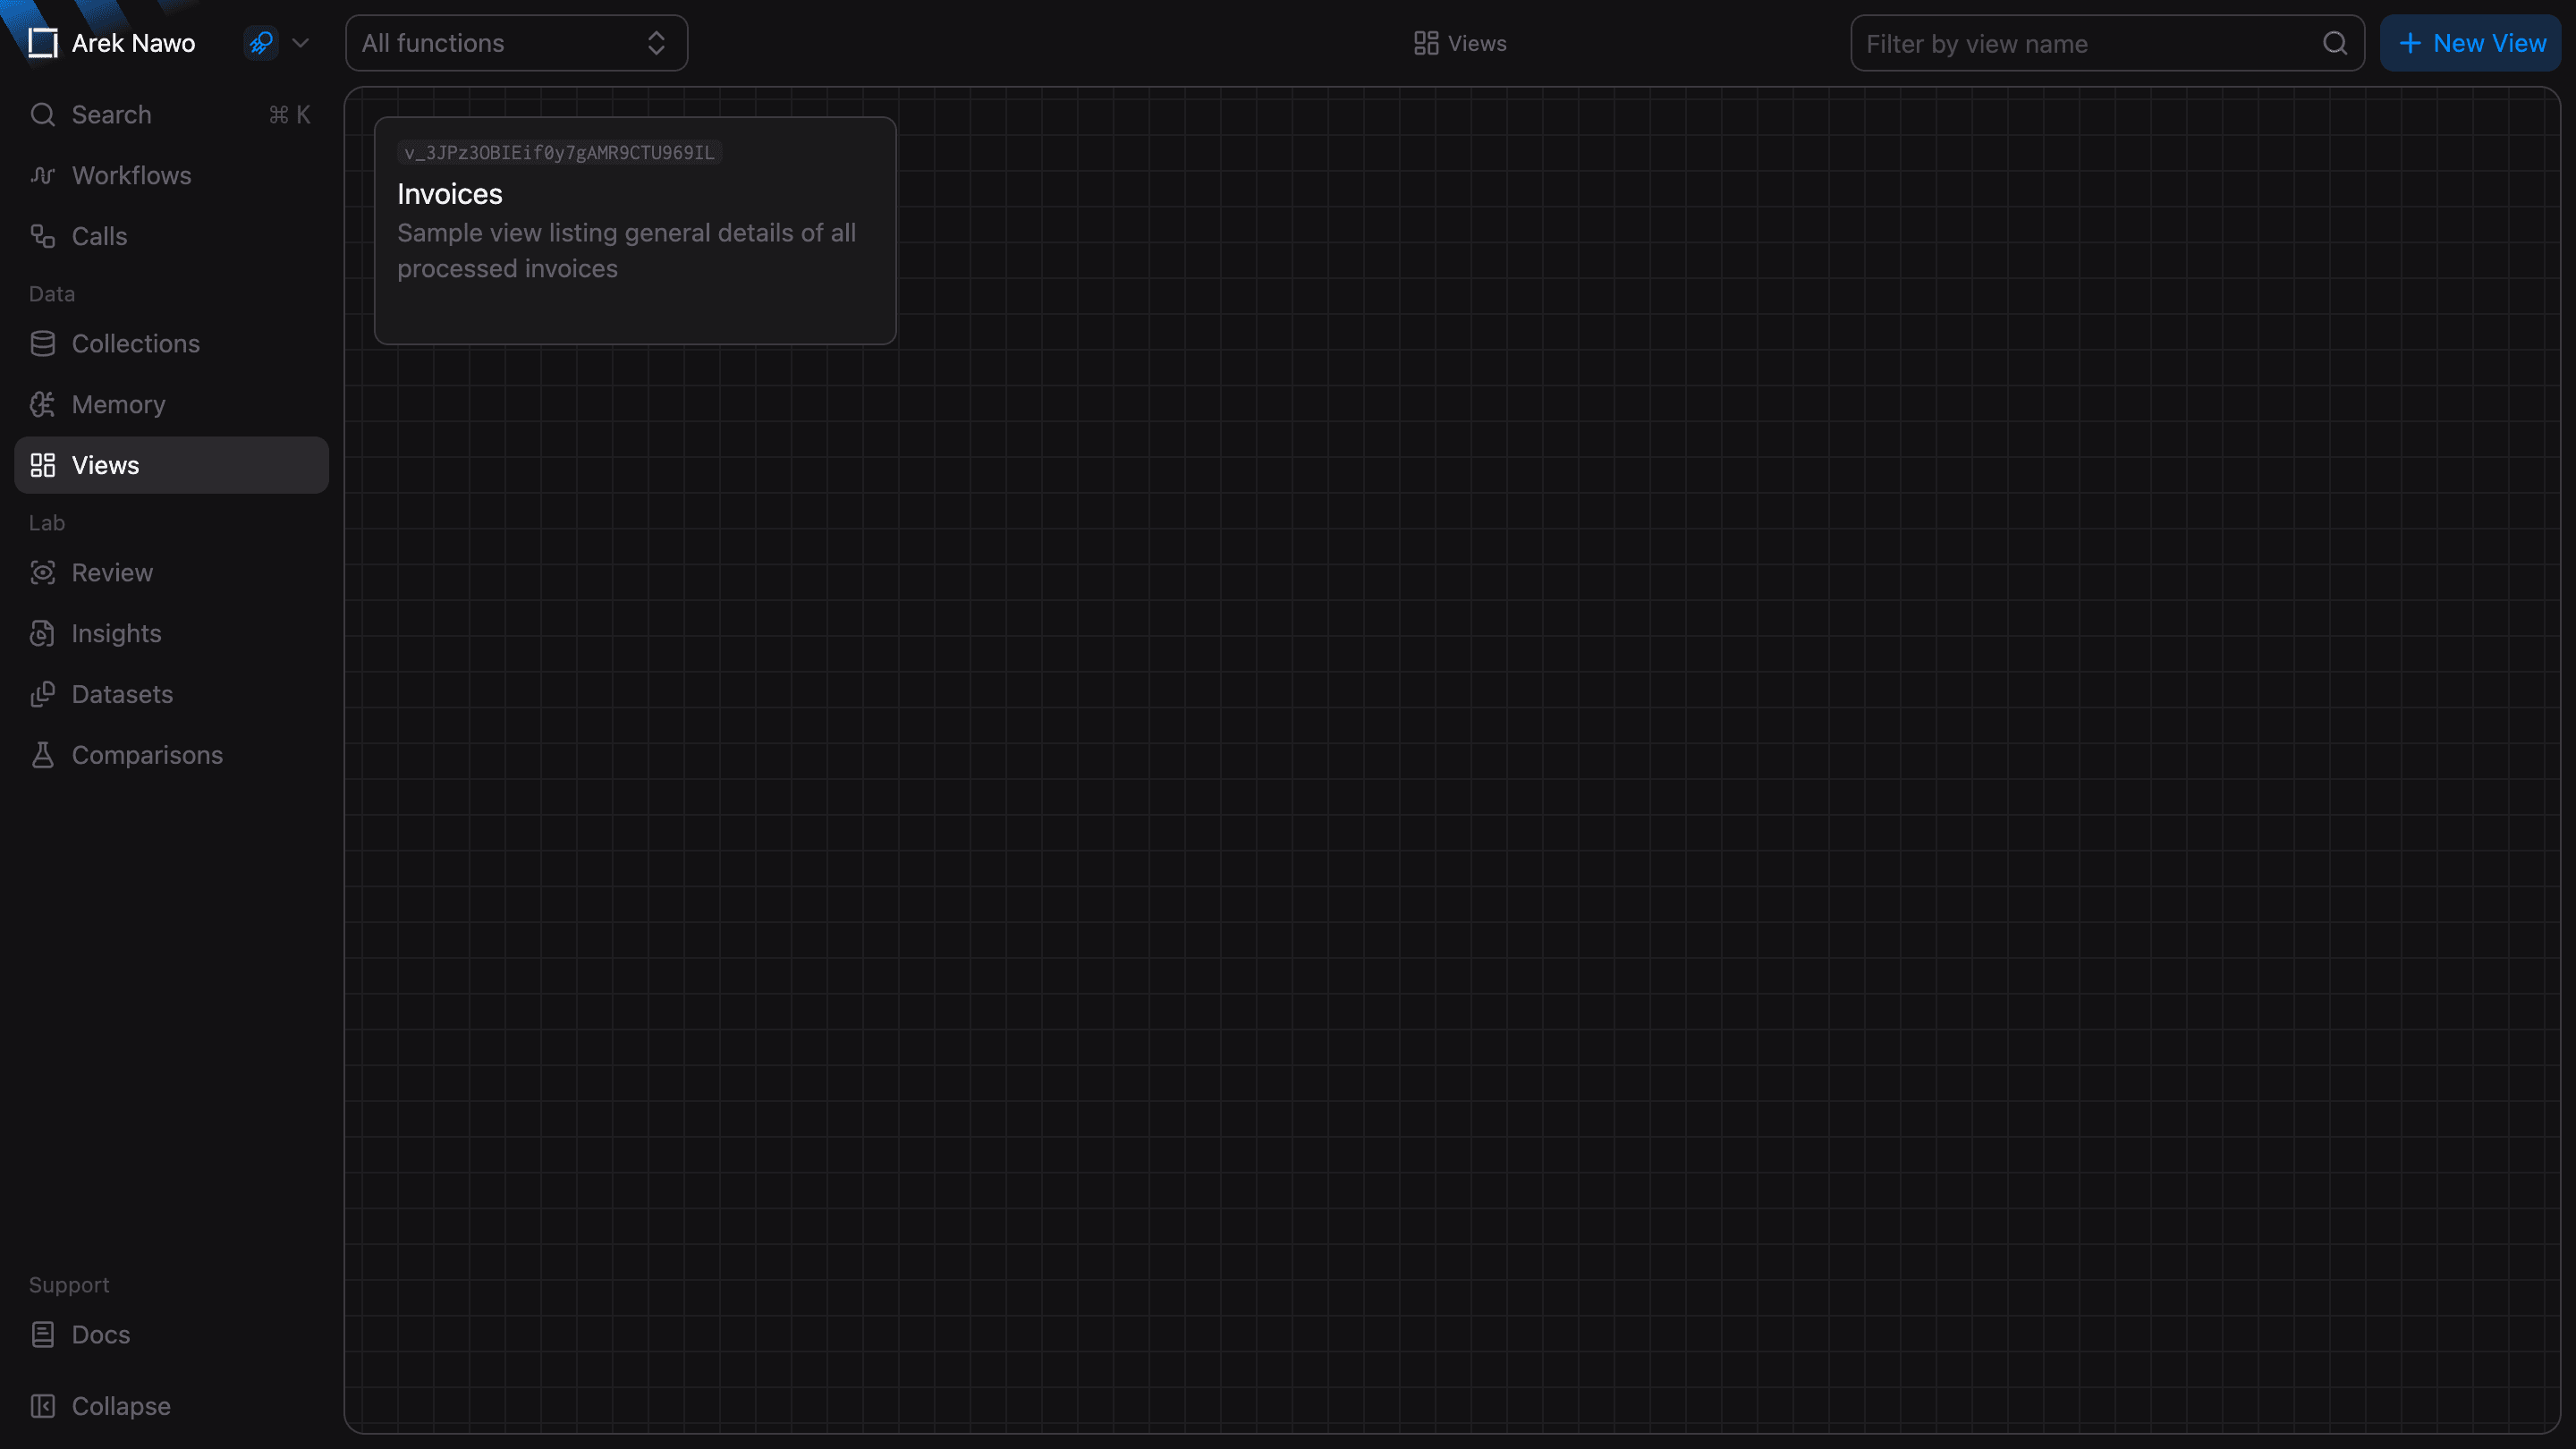
Use Views to turn function outputs into visual data tables and charts. Open Views under Data to find an existing view or create a new one.
Create a view
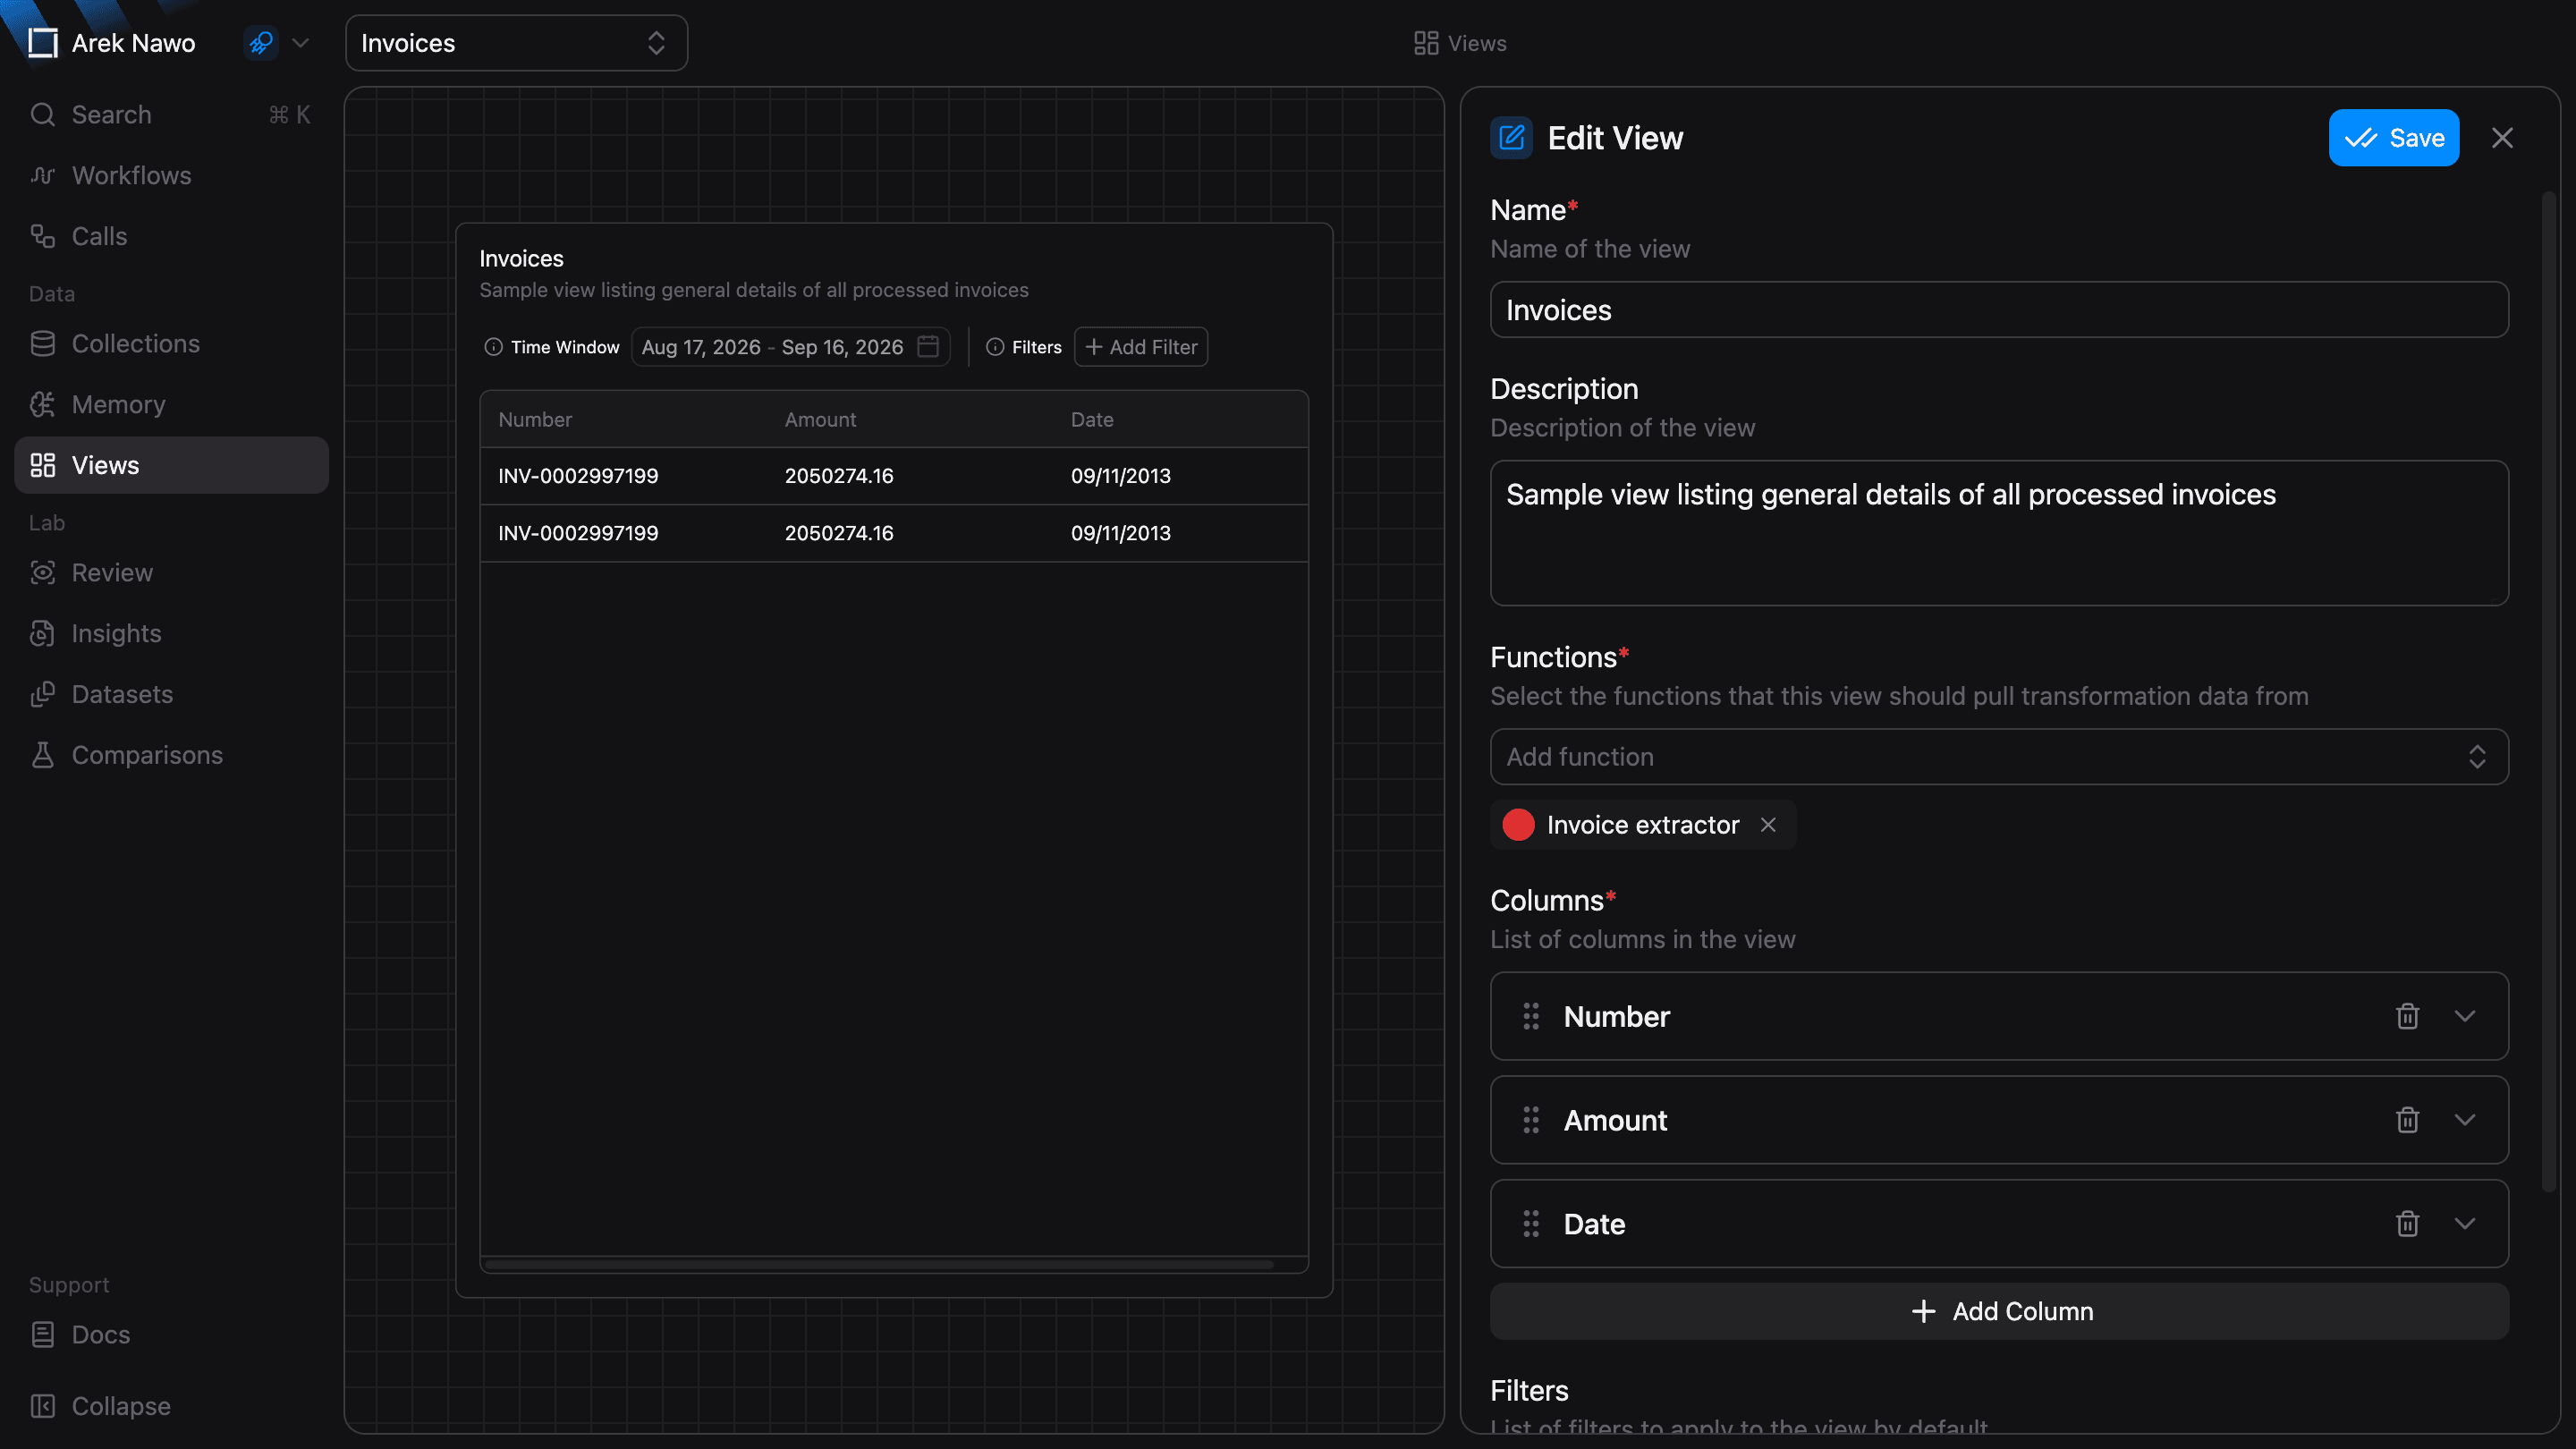
Select New View, give it a name, and choose the functions whose outputs you want to display. Add a column for each field you need.
Each column's Value Schema Path selects a field from the function output. For example, a column named Amount with the path total_amount shows the extracted invoice total from an Extract function, the schema of which includes that field.
Use the preview beside the editor to check your columns, then select Save. You can also add default filters to keep the view focused on the records you need.
Aggregations
Aggregations summarize the data in your view. For example, use Sum on an Amount column and set Group By Column to Vendor to compare invoice totals by vendor.
Choose a display type that fits the result. A bar chart makes it easier to compare groups, while a table shows the exact values.
Use a saved view
Use Time Window and Filters to focus on the data you need, such as recent outputs or invoices above a certain amount.
Select Edit View to change the source functions, columns, or summaries, then save your changes.