Workflow Calls
Inspect every call to a single workflow
Hand off to an LLM
The Calls tab inside a workflow shows the full execution history for that workflow, with a DAG view on the left and a detailed call inspector on the right.
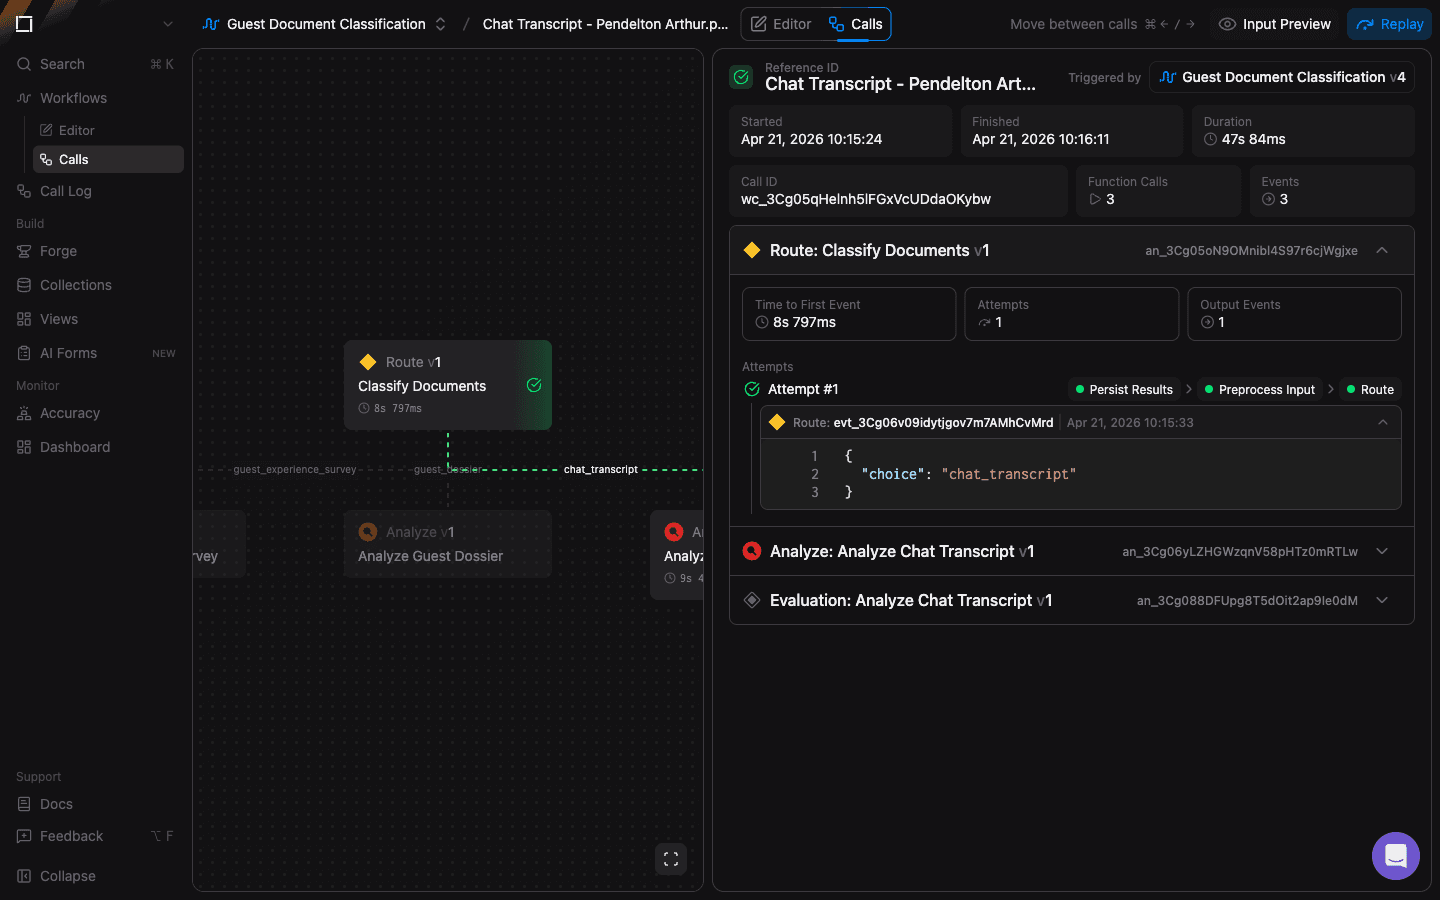
Call selector (top)
- Workflow picker (left) — switch between workflows without leaving the Calls view.
- Call picker (center) — dropdown of every call for the current workflow, labelled by the call's
referenceID. Use the⌘ ← / →shortcut to move between adjacent calls. - Input Preview (right) — opens the original input file (PDF, image, audio) that triggered the call in a side-by-side preview.
- Replay — re-runs the call using the current workflow version. Useful for validating that a fix to the workflow resolves an error seen in production.
Call summary (right, top)
For the selected call you'll see:
- Reference ID — the client-supplied
referenceIDfrom the original/v3/workflows/:name/callrequest. - Started / Finished / Duration — wall-clock timestamps and elapsed time.
- Call ID — the internal
wc_…identifier that uniquely names this call. - Function Calls / Events — counts of how many function invocations and downstream events this call produced.
- Triggered by — the workflow name and version responsible for this call.
Function execution timeline (right, below summary)
Every function the call visited is rendered as its own expandable card:
- Type and version — for example
Transform: EDI 990 v1with the function's internalfn_…ID. - Time to First Event / Attempts / Output Events — performance stats for that function call.
- Attempt #n — expandable block showing each attempt's stages: Preprocess Input → Linear Transform → Schematization → Persist Results. Each stage reports pass/fail status and timing.
- Transform event payload — the structured output produced by the attempt, with per-field confidence scores rendered as a percentage badge in the gutter (e.g.
99%). Hover a score to see the LLM judge's reasoning.
DAG view (left)
The DAG mirrors the workflow's topology, with each node annotated with:
- A green check on the node once it's finished successfully.
- Timing (e.g.
14s 629ms) and output count (▷ +1) under the node.
Use this view to spot slow or failing nodes at a glance before drilling into the per-stage details on the right.