Insights
Inspect operational metrics for the active environment
Use Insights to track processing activity in the active environment and see how call volume, errors, and processing time change.
Choose a date range to focus on the period you want to inspect. It applies to all sections on the page.
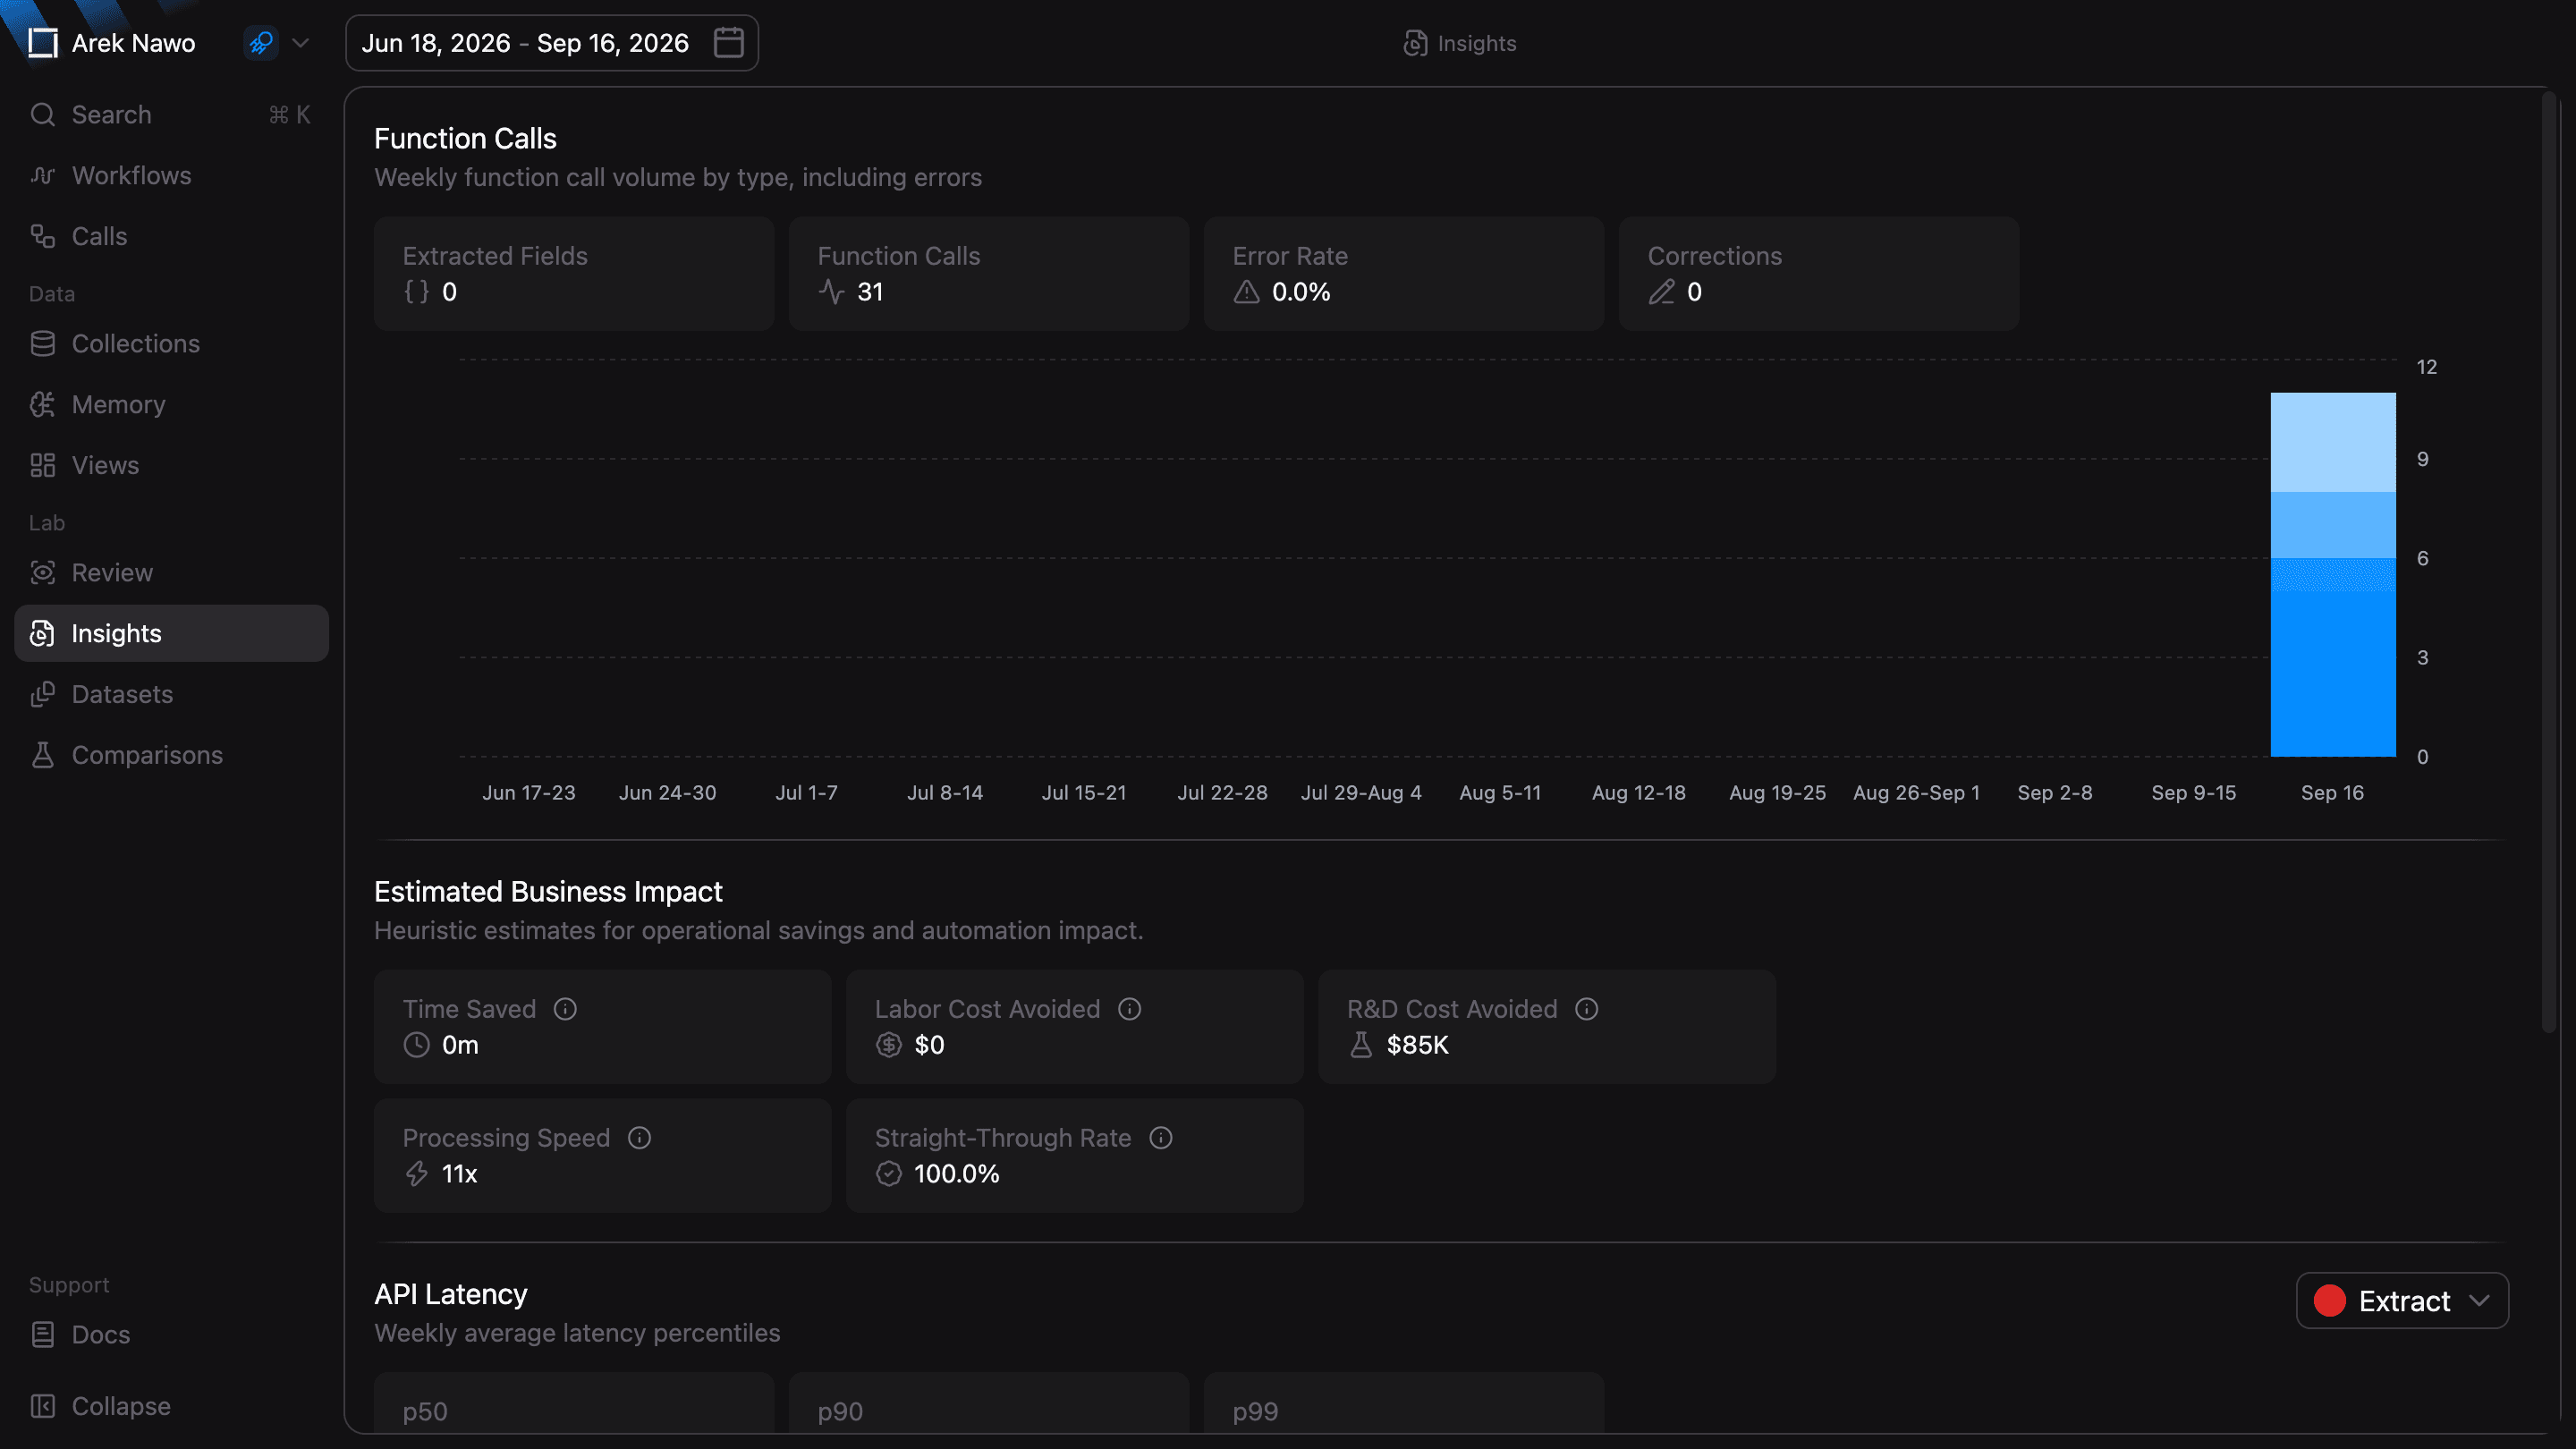
Function Calls
The chart groups calls by function type. These counts are for individual functions. A workflow that runs several functions contributes several calls.
API Latency
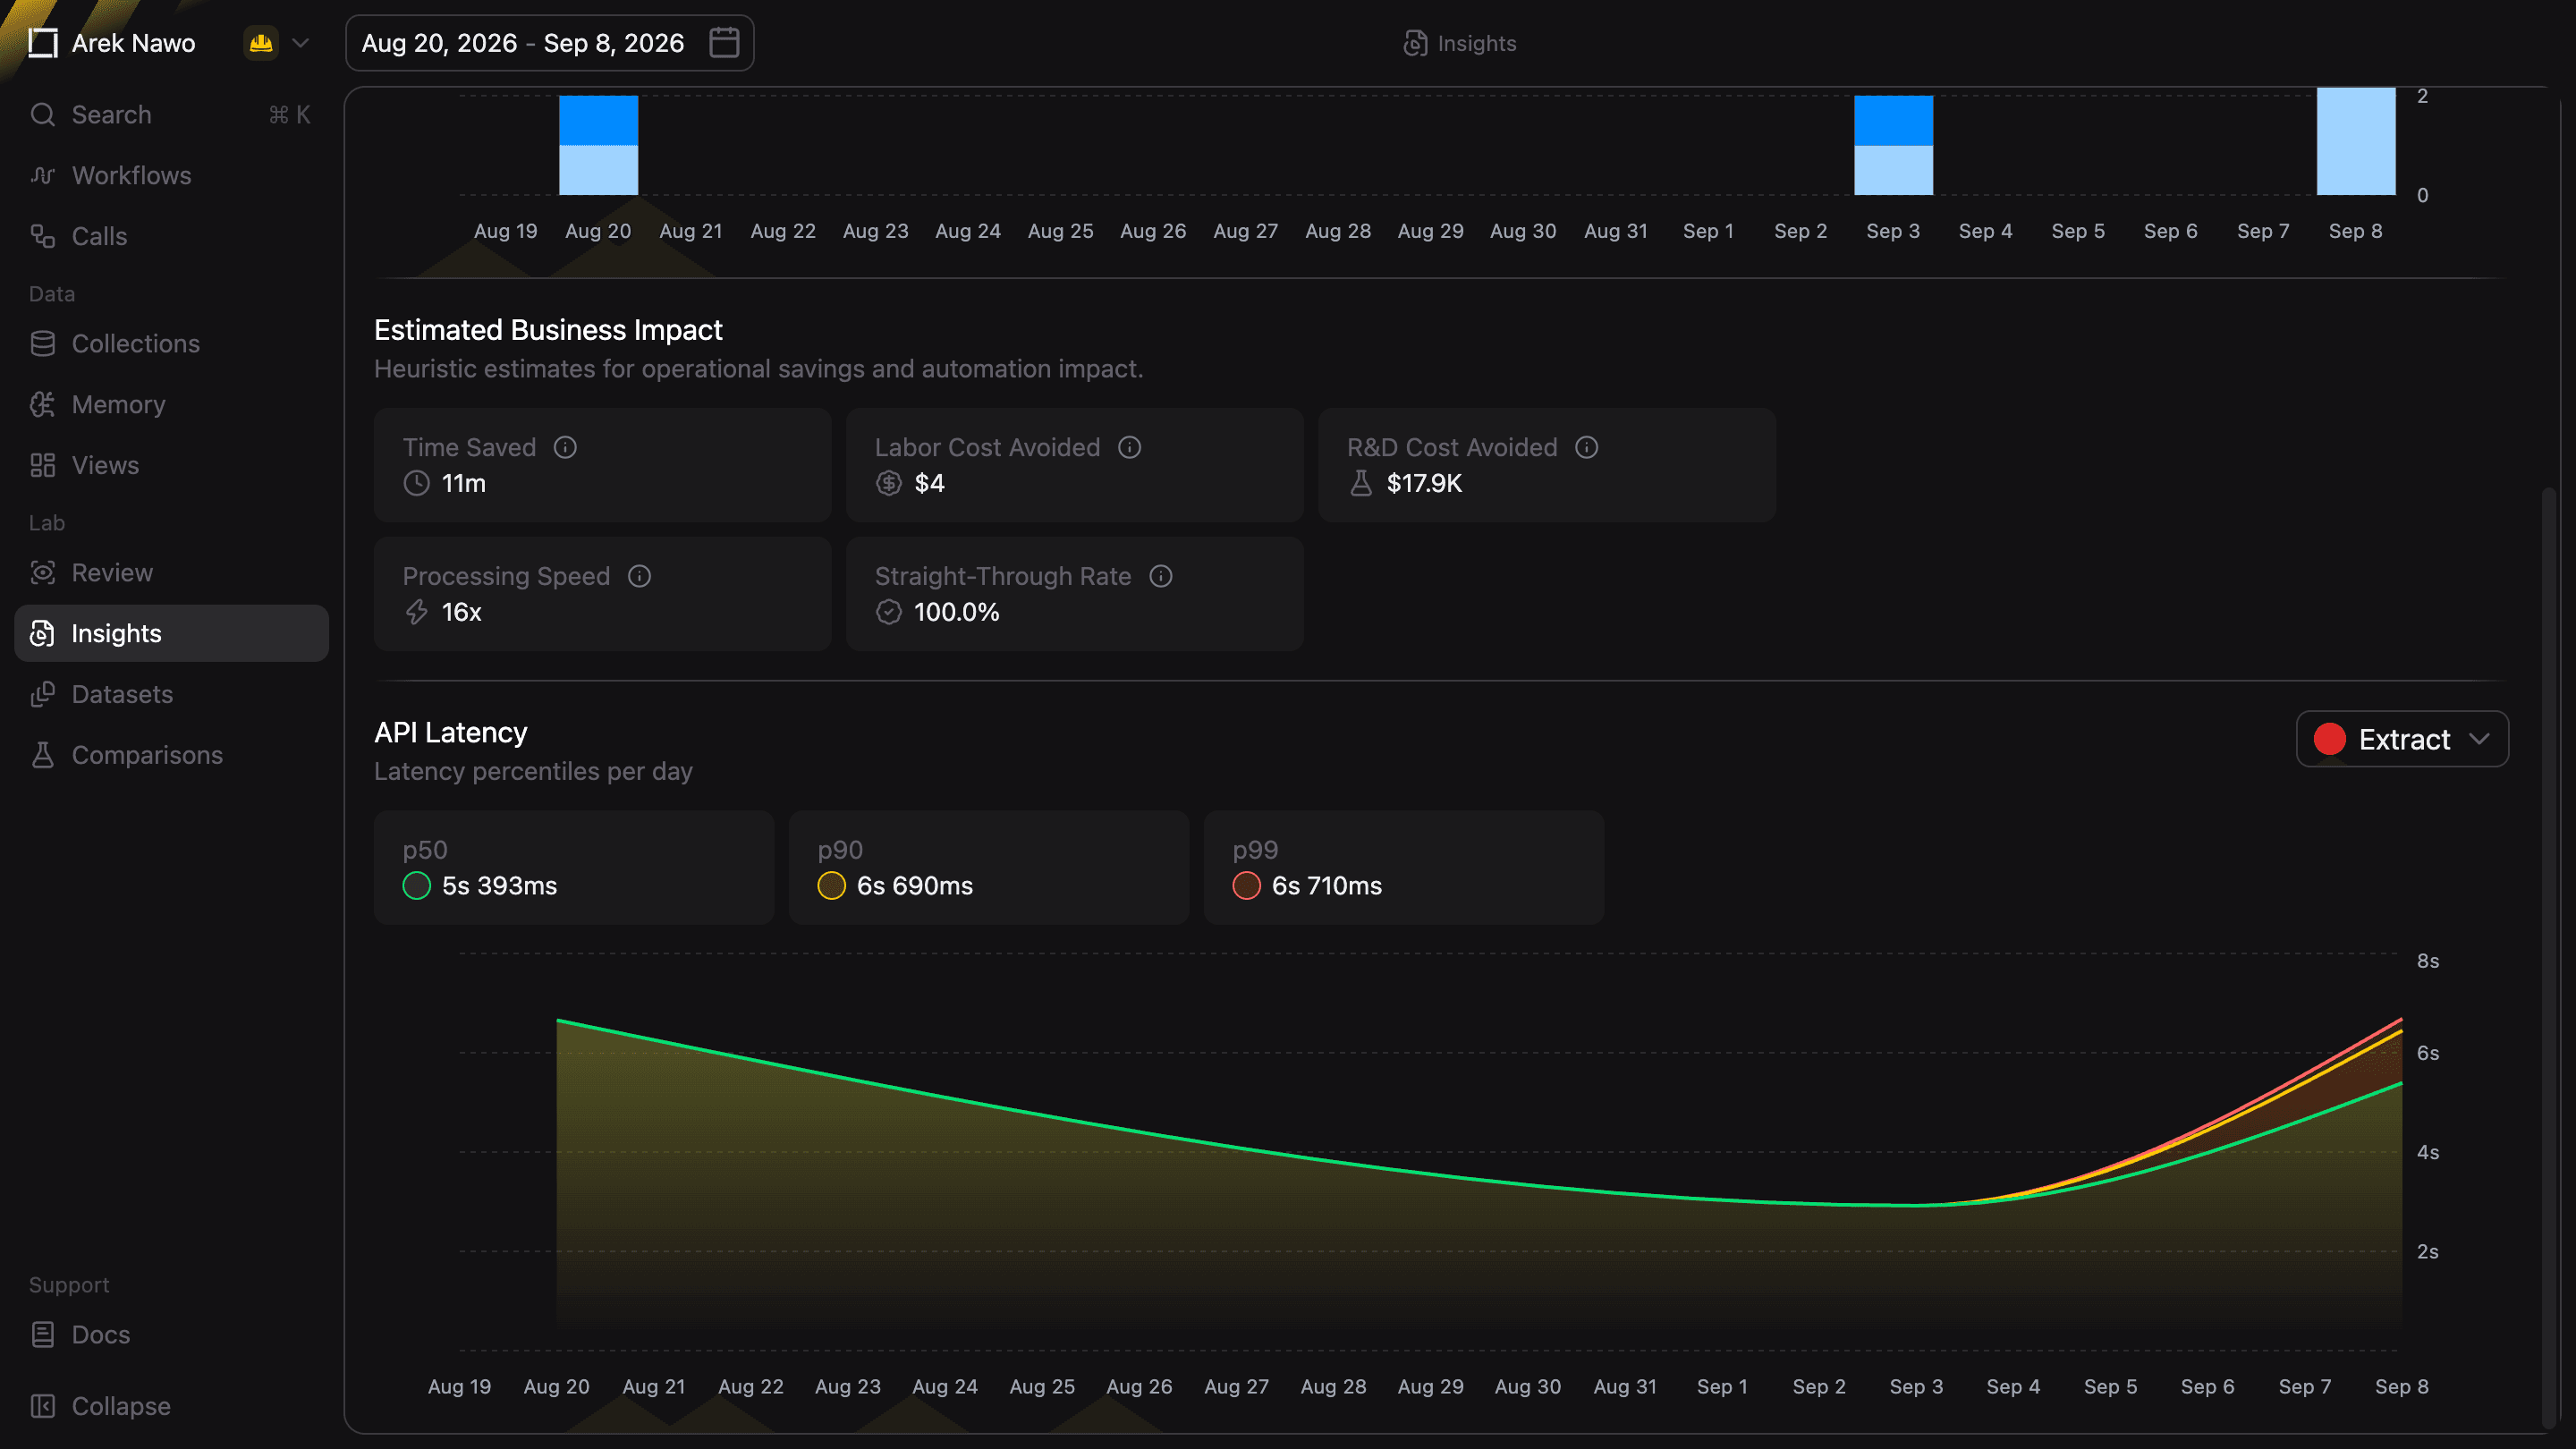
Select a function type to see how long its calls take. p50 is the median duration, while p90 and p99 help you inspect slower calls. For example, a p90 of 10 seconds means 90% of measured calls took 10 seconds or less.
Use the chart to spot changes over time. The summary values cover the selected date range.
Estimated Business Impact
This section estimates time and cost savings using processing activity and assumptions about manual work and development costs. Hover over a metric to see how it is calculated.
Straight-Through Rate uses correction counts to estimate how often calls complete without a correction. A call without a correction may still have been reviewed by a person.